![]() Barry Weinstein
Barry Weinstein
Volatility Markets Newswire
Introduction
VolatilityMarkets trend following trade
According to AQR the quantitative hedge fund and Yale University, over the past 100 years markets moved in trends. Trends are successive upwards and downwards movements in price that occur at a greater frequency than would be predicted by randomness alone. The following trade idea is a trend following trade idea which takes the assumption that the market will continue moving in the way it has over the previous sessions. Trend Trading, however is different than scalping due to the time horizon of the trade as trend following trades will take a week while scalping is done on a daily or intraday basis.
Market summary
Price
Intel Corporation last price was $ 29.03.
Trend analysis
In the short term Intel Corporation has been accelerating higher. In the long term Intel Corporation has been accelerating higher.
Value analysis
Over the past 20 days, the Intel Corporation price increased 13 days and decreased 7 days.
For every up day, there were 0.54 down days.
The average return on days where the price increased is 1.9715%.
The average return on days where the price decreased is -1.583%.
Performance
Over the past 20 Days, the price has increased by 15.11% percent.
Over the past 20 days, the average return per day has been 0.7555% percent.
Trade idea
Taking into account the long term trend accelerating higher, we propose a long trade idea with time horizon.
Trend trade idea
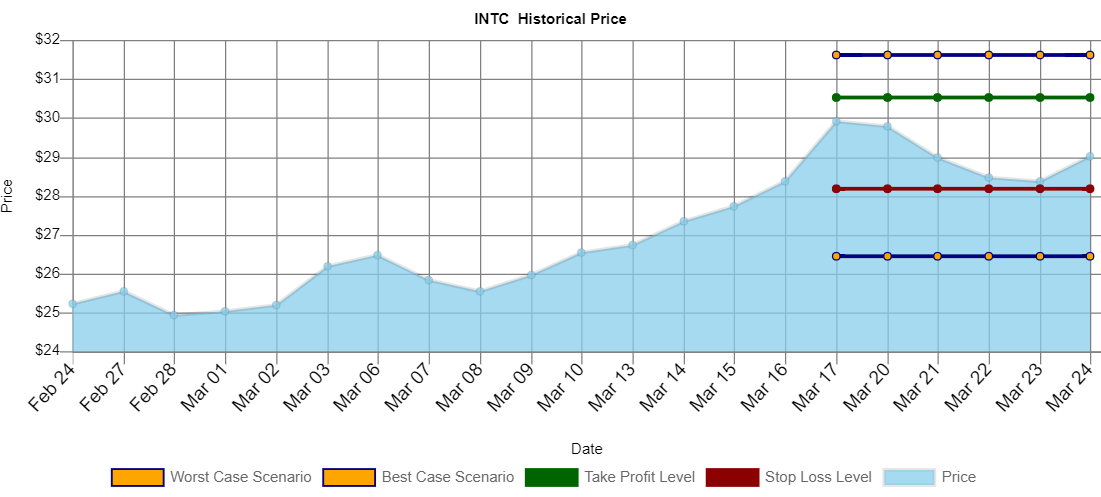
Buy $ 116,761 USD of Intel Corporation, take profit at $ 29.4558 level with 25.0% odds for a $ 1,712 USD gain, stop out at $ 28.1731 with 50.0% odds for a $ 1,000 USD loss through a one Week time horizon
Intraday predictions
Intel Corporation trend analysis
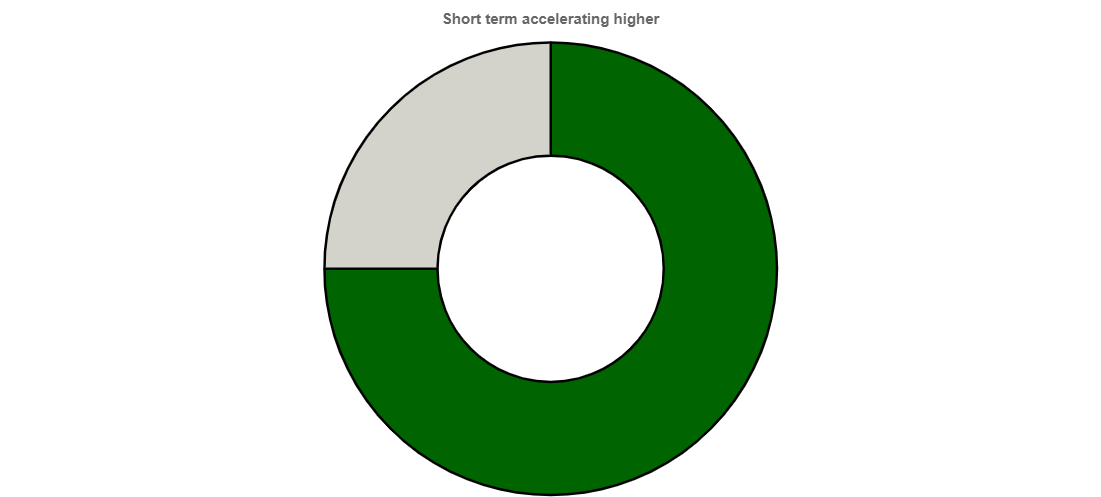
Intel Corporation last price was $ 29.03. The short term trend accelerating higher is stronger than the long term trend accelerating higher. This trade goes long when the last change was higher and accelerating.
Intel Corporation value analysis
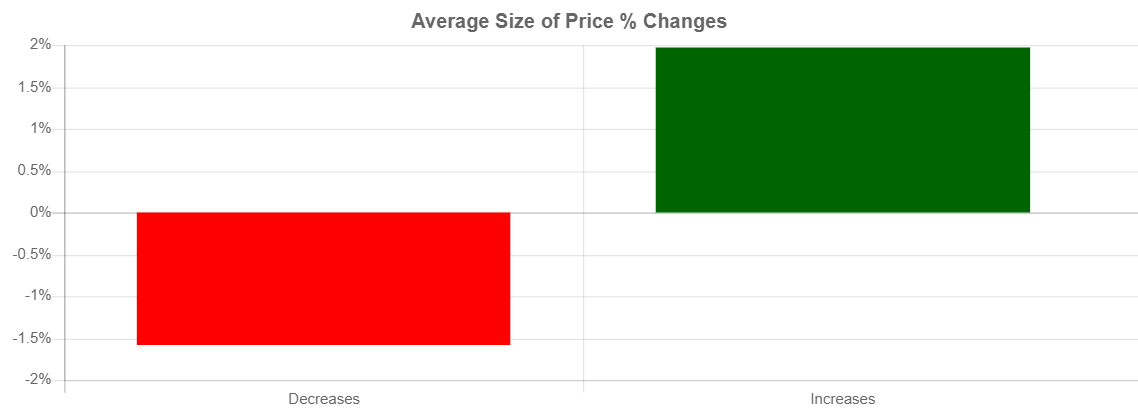
Over the past 20 days, the Intel Corporation price increased 13 days and decreased 7 days. For every up day, there were 0.54 down days. The average return on days where the price increased is 1.9715% The average return on days where the price decreased is -1.583% Over the past 20 Days, the price has increased by 15.11% percent. Over the past 20 days, the average return per day has been 0.7555% percent.
Intel Corporation worst/best case scenario analysis
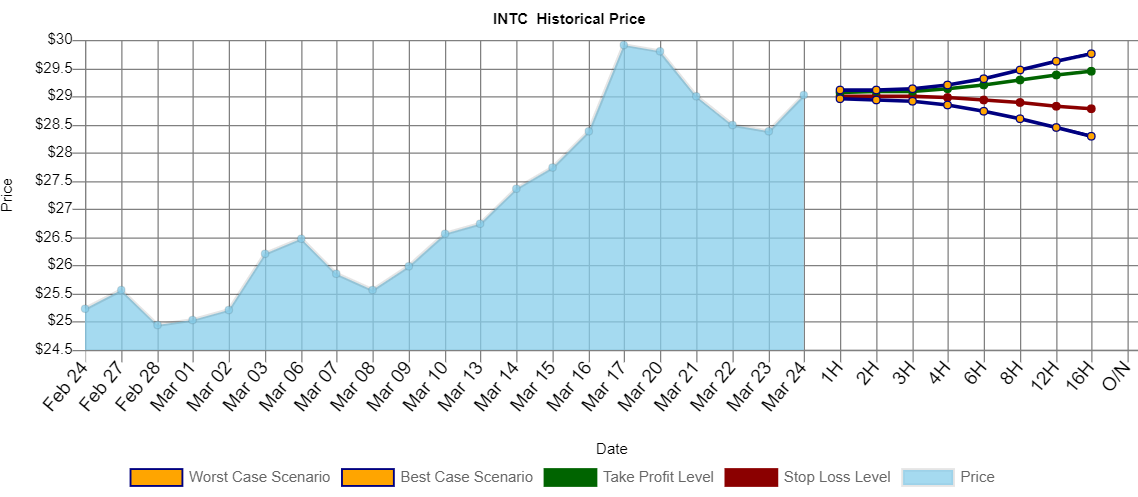
Within 1 week, our worst case scenario where we are 95% certain that this level won't trade for Intel Corporation, is $ 26.4482, and the best case scenario overnight is $ 31.6118. levels outside of this range are unlikely, but still possible, to trade. We are 50% confident that $ 28.1731 could trade and that $ 29.4558 could trade. These levels are within statistical probability.
Expected range
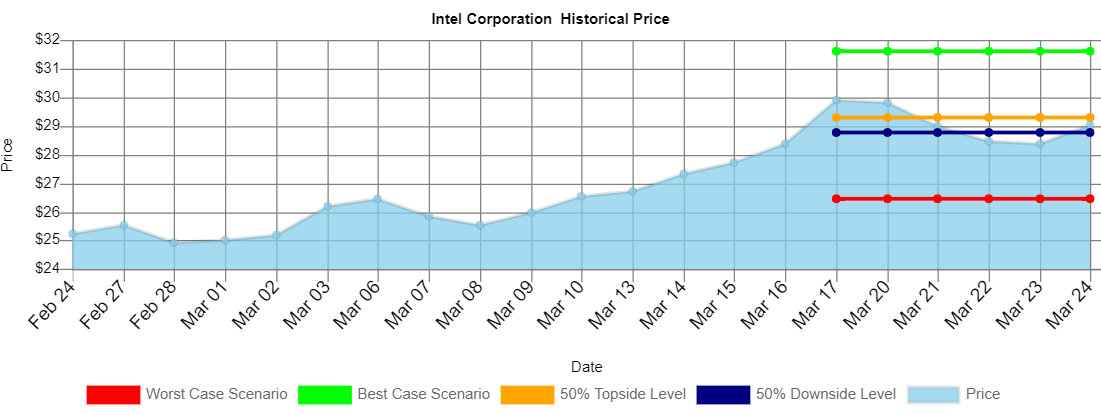
Within 1 week, our worst case scenario where we are 95% certain that this level won't trade for INTC, is $ 26.4482, and the best case scenario overnight is $ 31.6118. levels outside of this range are unlikely, but still possible, to trade.
We are 50% confident that $ 28.1731 could trade and that $ 29.4558 could trade. These levels are within statistical probability.
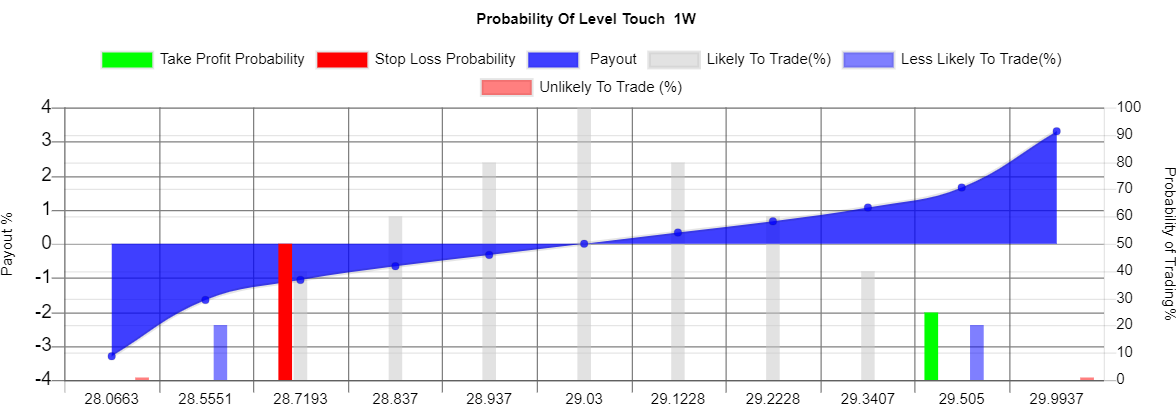
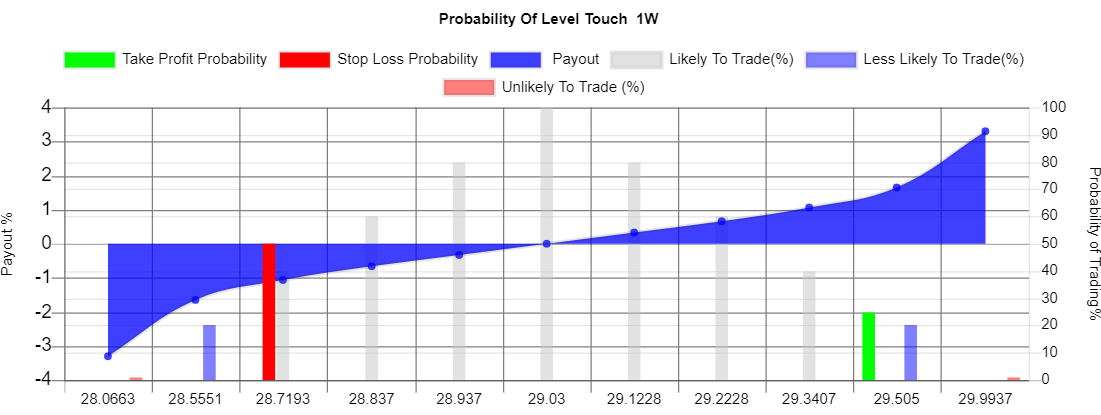
Probability vs payout chart
This graph contrasts the percentage payout of holding a position vs the probability that the payout occurs. The red and green columns represent the probability of stopping out and taking profit and their associated payouts.
Key takeaways
-
Price today $ 29.03
-
Over the past 20 days, the Intel Corporation price increased 13 days and decreased 7 Days.
-
For every up day, there were 0.54 down days.
-
The average return on days where the price increased is 1.9715%.
-
The average return on days where the price decreased is -1.583%.
-
Over the past 20 Days, the price has increased by 15.11% percent.
-
Over the past 20 days, the average return per day has been 0.7555% percent.
-
Over the past 20 days, The price has on average been accelerating: $ 0.0168 per day higher.
-
Over the last session, the price increased by $ 0.65.
-
Over the last session, the price increased by 2.2391 %.
-
Over the last session, the price accelerated by $ 0.55.
Volatility Markets provides trend following trade ideas for momentum traders. The Volatility Markets Newswire measures the direction and acceleration of a security and then structures a trade idea to capitalize on the trend. While trends have been shown to exist in markets over the past 100 years, they are no guarantee of future asset prices. You should take these ideas lightly and at your own risk.


Recommended content
Editors’ Picks

EUR/USD stays near 1.1350 after mixed EU data
EUR/USD remains on the back foot, trading near 1.1350 in the European trading hours on Tuesday. The data from the Eurozone showed that Industrial Production expanded by 1.1% in February. On a negative note, ZEW Survey - Economic Sentiment slumped to -18.5 in April from 39.8.

GBP/USD battles 1.3200 after UK jobs data
GBP/USD is defending minor bids near the 1.3200 mark in the early European session on Tuesday. The latest data from the UK showed that Unemployment Rate steadied at 4% in the quarter to February while Average Earnings disappointed, weighing negatively on the Pound Sterling.

Gold price bulls retain control amid trade jitters, Fed rate cut bets and weaker USD
Gold price (XAU/USD) maintains its bid tone through the first half of the European session on Tuesday and currently trades around the $3,230 area, well within striking distance of the all-time peak touched the previous day.

Canada CPI expected to hold steady in March ahead of BoC policy decision
Statistics Canada will release the March Consumer Price Index report on Tuesday. Annualised inflation is expected to have held steady at 2.6%, matching the February reading. Market players anticipate a monthly advance of 0.7%, easing from the previous 1.1%.

Is a recession looming?
Wall Street skyrockets after Trump announces tariff delay. But gains remain limited as Trade War with China continues. Recession odds have eased, but investors remain fearful. The worst may not be over, deeper market wounds still possible.

The Best brokers to trade EUR/USD
SPONSORED Discover the top brokers for trading EUR/USD in 2025. Our list features brokers with competitive spreads, fast execution, and powerful platforms. Whether you're a beginner or an expert, find the right partner to navigate the dynamic Forex market.