INFY Elliott Wave technical analysis [Video]
![INFY Elliott Wave technical analysis [Video]](https://editorial.fxstreet.com/images/Markets/Equities/Industries/Transportation/goods-train-637435358066371311_XtraLarge.jpg)
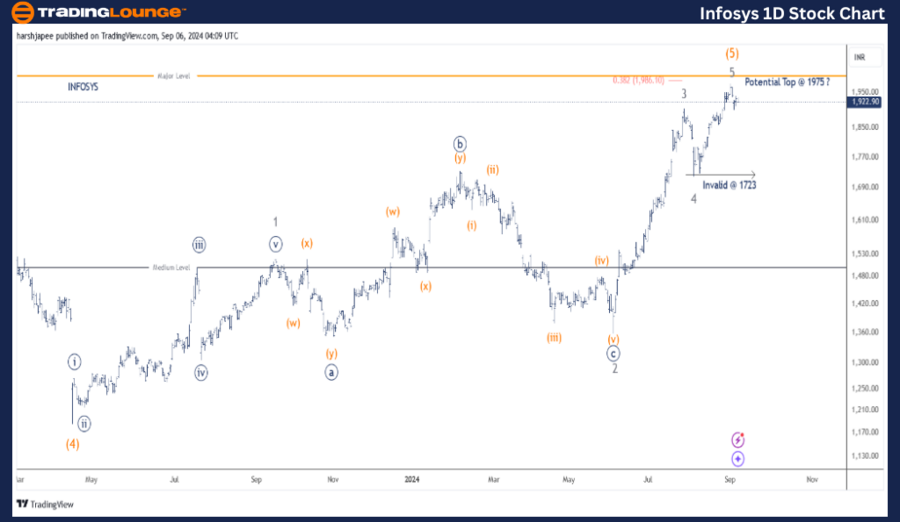
INFOSYS – INFY (1D chart) Elliott Wave technical analysis
Function: Larger Degree Trend Higher (Intermediate degree, orange).
Mode: Motive.
Structure: Impulse.
Position: Minor Wave 5 Grey.
Details: Minor Wave 5 Grey is progressing higher within Intermediate Wave (5) Orange against 1723. Alternatively Minor Wave 5 Grey is potentially complete at 1975.
Invalidation point: 1723.
INFOSYS Daily Chart Technical Analysis and potential Elliott Wave Counts.
INFOSYS daily chart is suggesting a major potential top formation around 1975 high or a top is approaching soon around 1986-2000 zone, as highlighted by fibonacci 0.382 extension. Either way, a larger degree correction could be soon underway.
INFOSYS terminated its Intermediate Wave (4) around 1180 mark in April 2023. The stock has progressed higher through 1975 level registered on September 02, 2024. The entire rally can be sub divided into five waves marked as Minor 1 through 5.
Minor Wave 4 completed around 1723 mark and a break lower will confirm the proposed potential bearish outlook here. Alternatively, the stock could rally through 1986-2000 zone before terminating Minor Wave 5 of Intermediate Wave (5).
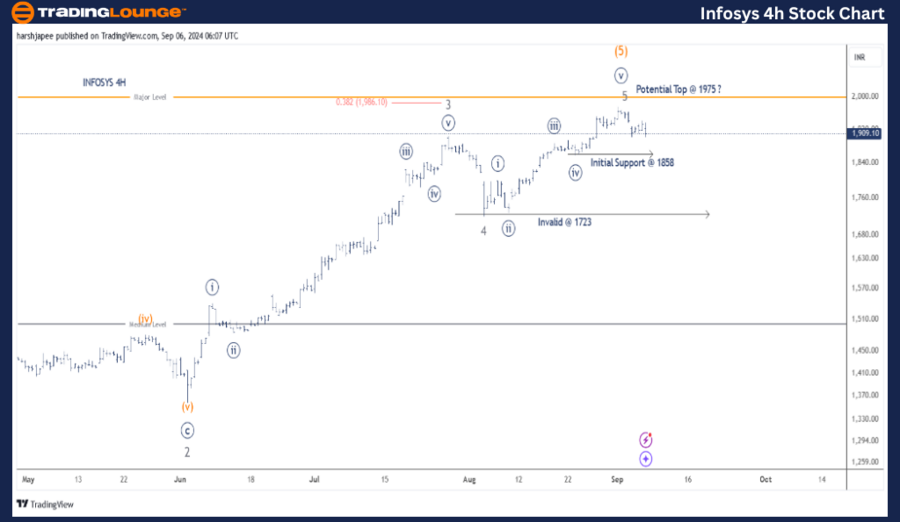
INFOSYS – INFY (4H chart) Elliott Wave technical analysis
Function: Larger Degree Trend Higher (Intermediate degree, orange).
Mode: Motive.
Structure: Impulse.
Position: Minor Wave 5 Grey.
Details: Minor Wave 5 Grey is progressing higher within Intermediate Wave (5) Orange against 1723. Alternatively Minor Wave 5 Grey is potentially complete at 1975. With general indice Nifty 50 and most technologies stock topping it is good to take profits now.
Invalidation point: 1723.
TCS 4H Chart Technical Analysis and potential Elliott Wave Counts:
INFOSYS 4H chart highlights the sub waves within Minor Waves 3 and 4 respectively. Each can be marked as potential impulse with Minute Wave ((v)) Navy potentially complete around 1975. Alternatively, Minor Wave 5 is extending and would rally after a correction.
Also note immediate support coming through 1858 and a break there will add further confidence to the bearish structure. The drop is still in its early stages but traders are advised to at least take profits now.
Conclusion
INFOSYS might have either topped at 1975 or is close to carving a top around 1986-2000 range. Either ways, a correction is due soon.
Elliott Wave analyst: Harsh Japee.
INFOSYS – INFY (4H chart) Elliott Wave technical analysis [Video]
Author

Peter Mathers
TradingLounge
Peter Mathers started actively trading in 1982. He began his career at Hoei and Shoin, a Japanese futures trading company.


