Indian Rupee flat lines, with all eyes on Fed rate decision
- The Indian Rupee trades flat in Tuesday’s early European session.
- The month-end US Dollar demand and India’s equity outflows might weigh on the INR.
- The Fed Interest Rate Decision will be the highlight on Wednesday.

The Indian Rupee (INR) trades on a flat note on Tuesday despite the modest recovery of the US Dollar (USD). However, the local currency remains under pressure amid month-end corporate demand for USD and substantial foreign fund outflows from Indian equities. Furthermore, the volatile Chinese Yuan and weaker sentiment contribute to the INR’s downside.
Nonetheless, extended losses in crude oil prices might limit the downside for the Indian Rupee as India is the third largest consumer of oil behind the US and China. Investors will closely watch the US Federal Reserve (Fed) Interest Rate Decision on Wednesday. The Fed is widely expected to keep rates unchanged in the range of 5.25%-5.50% for the eighth time in a row at its July meeting. Market players will shift their attention to the Indian HSBC Manufacturing PMI and US employment data later this week, which will be released on Thursday and Friday, respectively.
Daily Digest Market Movers: Indian Rupee holds steady despite multiple challenges
- “Rupee has been continuously depreciating due to equity outflows and tracking Asian currencies. There is Dollar demand from importers. Despite the fall in the US Dollar index, the Rupee is depreciating because the market is not looking at it right now,” said V R C Reddy, head of treasury at Karur Vysya Bank.
- The final reading of the Indian HSBC Manufacturing Purchasing Managers Index (PMI) is estimated to improve to 58.5 in July from the previous reading of 58.3.
- "The case to cut is already strong, and the Fed will likely use the July meeting to plant a seed that a cut in September is on the table," noted Ryan Sweet, chief US economist at Oxford Economics.
- Investors are now seeing that the first rate cut will come by mid-September, pricing in 100% of the Fed rate cut by at least a quarter-percentage-point by then, according to data from the CME FedWatch Tool.
- The US Dallas Fed Manufacturing Business Index came in at -17.5 in July from -15.1 in the previous reading.
Technical analysis: Indian Rupee remains bearish in the longer term
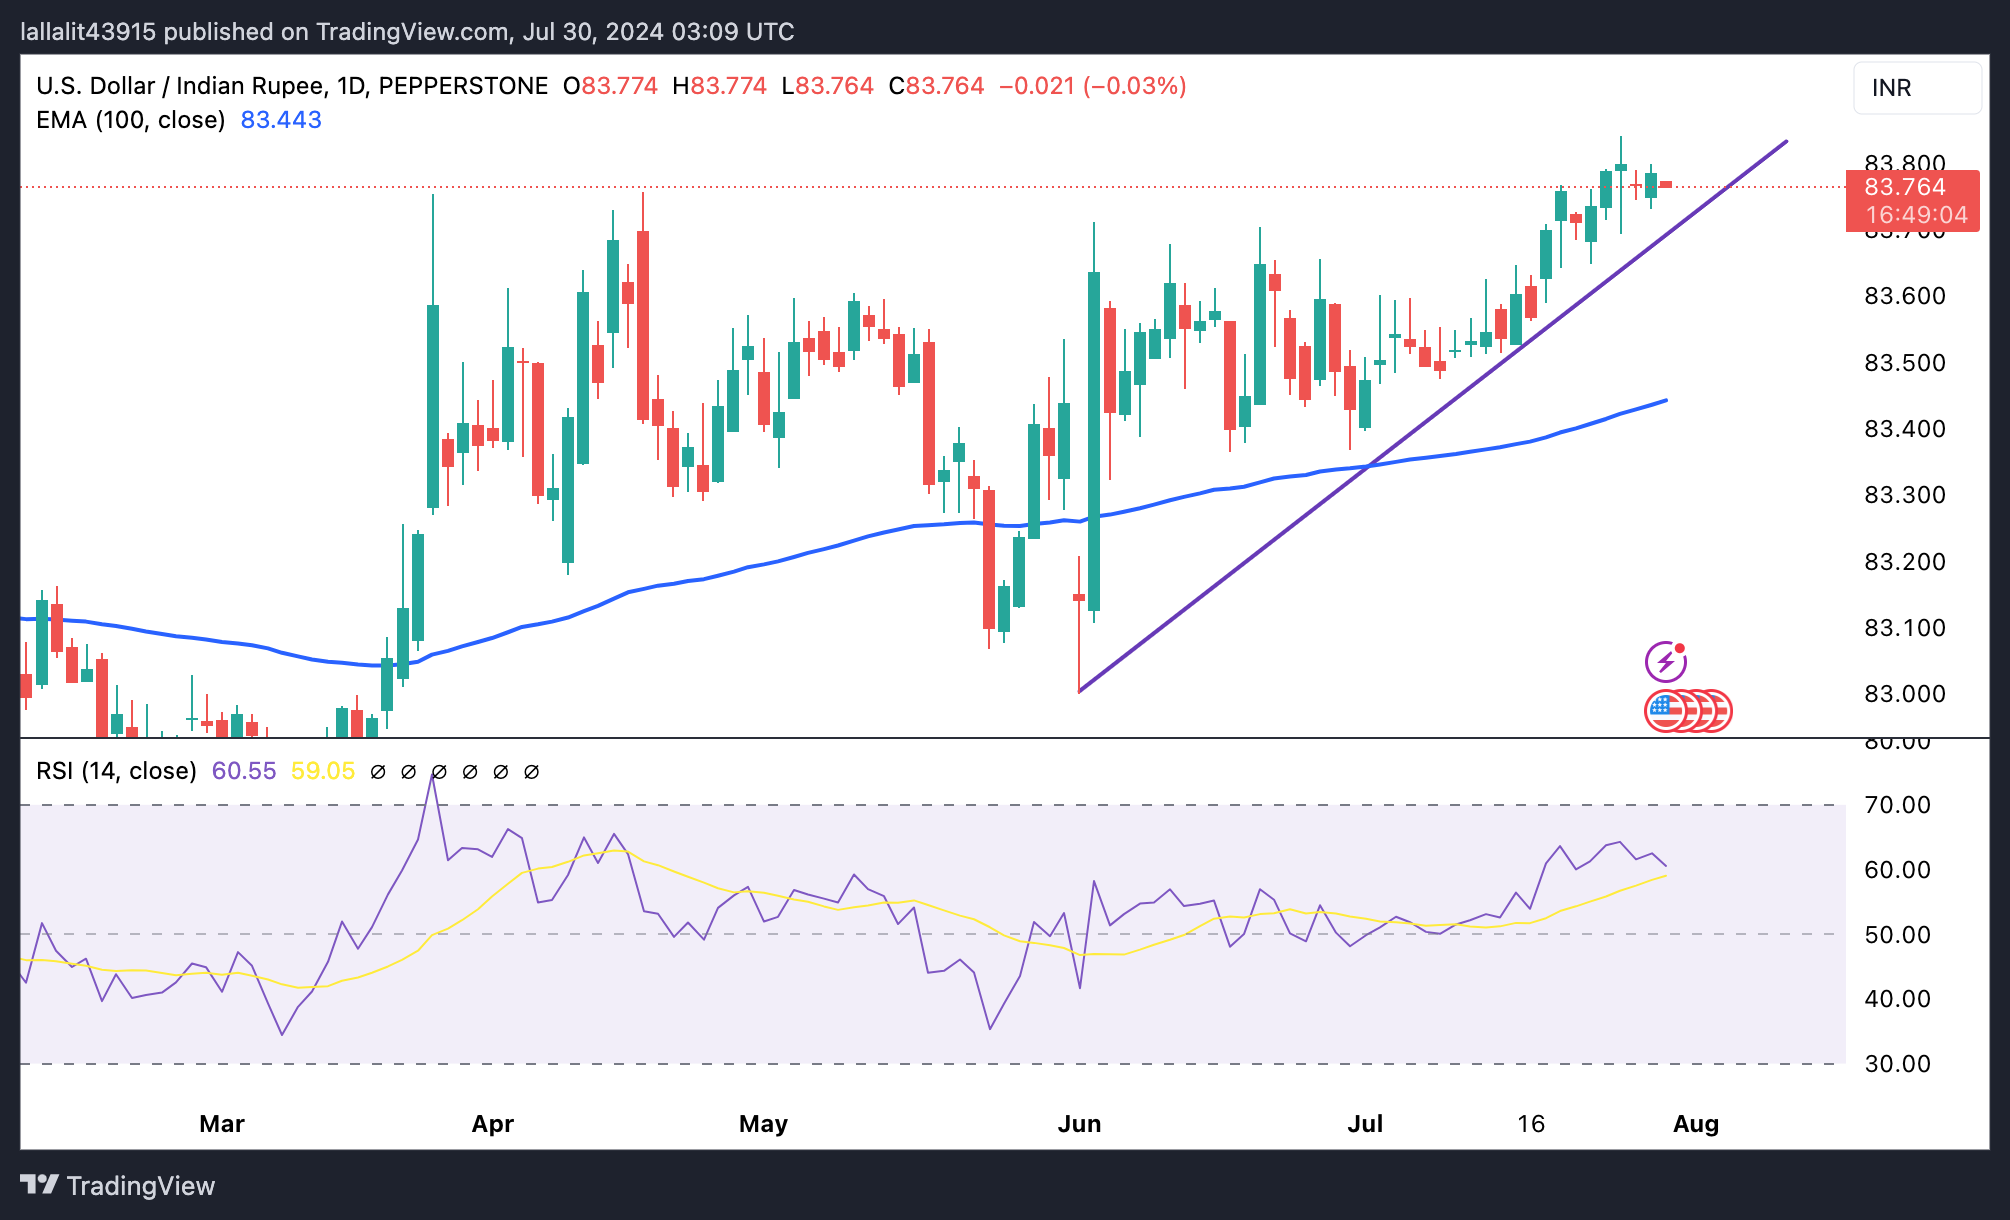
Indian Rupee remains sideways on the day. The constructive bias of the USD/INR pair remains in place as the pair has held above the key 100-day Exponential Moving Average (EMA) and is depicted by an uptrend line since June 3 on the daily chart. The 14-day Relative Strength Index (RSI) stands above the midline near 61.45, indicating bullish momentum in the near term and longer term.
The all-time high of 83.85 acts as an immediate resistance level for the pair. Extended gains above this barrier open USD/INR to a move to the 84.00 psychological level.
A resumption of the bearish swing might pave the way to the uptrend line around 83.70. The next contention level is located at 83.51, a low of July 12. The crucial support level is seen at 83.44, the 100-day EMA.
US Dollar price today
The table below shows the percentage change of US Dollar (USD) against listed major currencies today. US Dollar was the strongest against the Japanese Yen.
| USD | EUR | GBP | CAD | AUD | JPY | NZD | CHF | |
| USD | -0.01% | 0.08% | -0.07% | -0.06% | 0.83% | -0.33% | 0.15% | |
| EUR | 0.00% | 0.07% | -0.08% | -0.07% | 0.83% | -0.33% | 0.15% | |
| GBP | -0.07% | -0.09% | -0.15% | -0.13% | 0.76% | -0.41% | 0.09% | |
| CAD | 0.06% | 0.08% | 0.13% | 0.00% | 0.90% | -0.27% | 0.22% | |
| AUD | 0.05% | 0.09% | 0.13% | 0.01% | 0.90% | -0.27% | 0.23% | |
| JPY | -0.84% | -0.85% | -0.77% | -0.93% | -0.89% | -1.18% | -0.70% | |
| NZD | 0.31% | 0.33% | 0.38% | 0.26% | 0.26% | 1.16% | 0.49% | |
| CHF | -0.17% | -0.18% | -0.10% | -0.24% | -0.21% | 0.67% | -0.50% |
The heat map shows percentage changes of major currencies against each other. The base currency is picked from the left column, while the quote currency is picked from the top row. For example, if you pick the Euro from the left column and move along the horizontal line to the Japanese Yen, the percentage change displayed in the box will represent EUR (base)/JPY (quote).
Fed FAQs
Monetary policy in the US is shaped by the Federal Reserve (Fed). The Fed has two mandates: to achieve price stability and foster full employment. Its primary tool to achieve these goals is by adjusting interest rates. When prices are rising too quickly and inflation is above the Fed’s 2% target, it raises interest rates, increasing borrowing costs throughout the economy. This results in a stronger US Dollar (USD) as it makes the US a more attractive place for international investors to park their money. When inflation falls below 2% or the Unemployment Rate is too high, the Fed may lower interest rates to encourage borrowing, which weighs on the Greenback.
The Federal Reserve (Fed) holds eight policy meetings a year, where the Federal Open Market Committee (FOMC) assesses economic conditions and makes monetary policy decisions. The FOMC is attended by twelve Fed officials – the seven members of the Board of Governors, the president of the Federal Reserve Bank of New York, and four of the remaining eleven regional Reserve Bank presidents, who serve one-year terms on a rotating basis.
In extreme situations, the Federal Reserve may resort to a policy named Quantitative Easing (QE). QE is the process by which the Fed substantially increases the flow of credit in a stuck financial system. It is a non-standard policy measure used during crises or when inflation is extremely low. It was the Fed’s weapon of choice during the Great Financial Crisis in 2008. It involves the Fed printing more Dollars and using them to buy high grade bonds from financial institutions. QE usually weakens the US Dollar.
Quantitative tightening (QT) is the reverse process of QE, whereby the Federal Reserve stops buying bonds from financial institutions and does not reinvest the principal from the bonds it holds maturing, to purchase new bonds. It is usually positive for the value of the US Dollar.
Author

Lallalit Srijandorn
FXStreet
Lallalit Srijandorn is a Parisian at heart. She has lived in France since 2019 and now becomes a digital entrepreneur based in Paris and Bangkok.