ICICI BANK Elliott Wave technical analysis [Video]
![ICICI BANK Elliott Wave technical analysis [Video]](https://editorial.fxstreet.com/images/Markets/Equities/DAX/dax-macro-concept-57844002_XtraLarge.jpg)
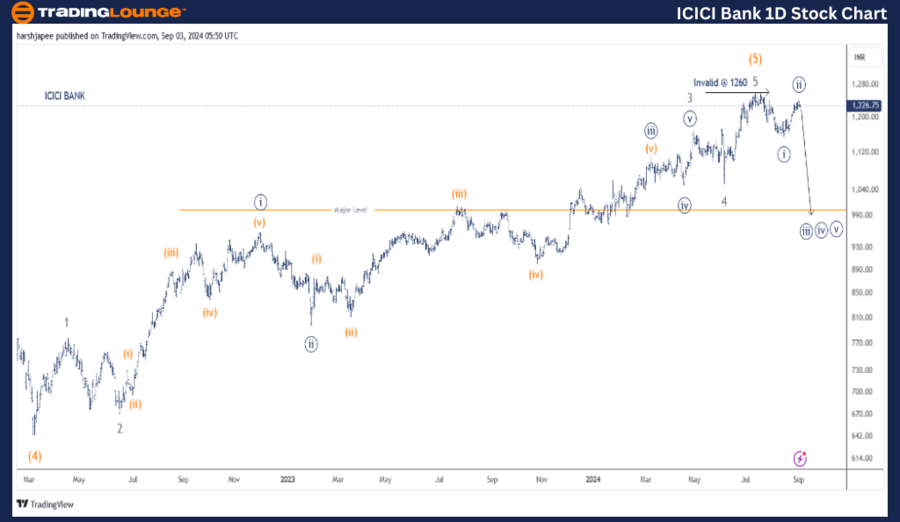
ICICI BANK One day chart Elliott Wave technical analysis
Function: Counter Trend (Intermediate degree, orange).
Mode: Corrective.
Structure: Impulse.
Position: Minute Wave ((ii)) Navy.
Details: The larger degree impulse Wave (5) Orange, looks complete. Further, the stock has produced Minute Wave ((i)) Navy and Wave ((ii)) as projected earlier. Expect a turn lower from here as Minute Wave ((iii)) resumes. No change
Invalidation point: 1260-90.
ICICI Bank Daily Chart Technical Analysis and potential Elliott Wave Counts:
ICICI Bank daily chart indicates a potential major top in place around 1260 mark in July 2024. The stock might have turned lower already against 1260 high and a medium term target could be 1050 initial support, Minor Wave 4 Grey.
Along with major banks, ICICI has also produced an impressive rally since March 2022 after terminating Intermediate Wave (4) around 640-45 mark. The stock has nearly doubled at 1260 subdividing into five waves, potentially terminating Intermediate Wave (5) Orange.
If the above proposed structure holds well, the stock could produce a larger degree corrective drop against 1260 high. Alternatively, Minor Wave 3 Grey might have terminated at 1260 and Minor Wave 4 could be underway now.
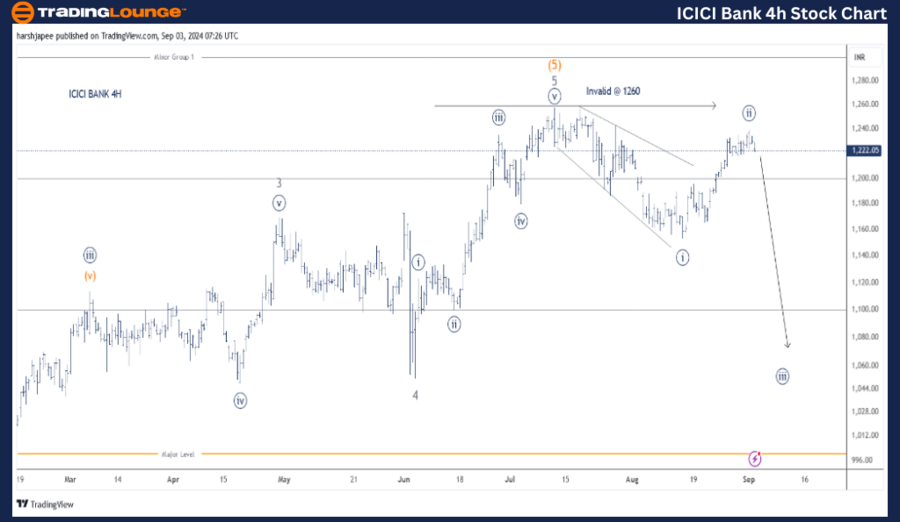
ICICI BANK Four-hour chart Elliott Wave/technical analysis
Function: Counter Trend (Intermediate degree, orange).
Mode: Corrective.
Structure: Impulse.
Position: Minute Wave ((ii)) Navy.
Details: The larger degree impulse Wave (5) Orange, looks complete. Further, the stock has produced Minute Wave ((i)) Navy and Wave ((ii)) as projected earlier. Expect a turn lower from here as Minute Wave ((iii)) begins to unfold.
Invalidation point: 1260-90.
ICICI Bank 4H Chart Technical Analysis and potential Elliott Wave Counts:
ICICI Bank 4H chart clearly indicated a five wave rally between 1050 and 1260 levels, which is marked as termination of Wave 5 Grey. Furthermore, prices might have carved lower degree Waves ((i)) and ((ii)) around 1155 and 1240 levels respectively.
If correct, Minute Wave ((iii)) Navy should begin to unfold lower from here and prices staying below 1260 mark. A break above 1260 would void the bearish outlook and suggest Wave 5 Grey is extending.
Conclusion
ICICI Bank should prepare to unfold Minor Wave (((iii)) Navy lower from current levels (1224) against 1260 high.
Technical analyst: Harsh Japee.
ICICI BANK one day chart Elliott Wave technical analysis [Video]
Author

Peter Mathers
TradingLounge
Peter Mathers started actively trading in 1982. He began his career at Hoei and Shoin, a Japanese futures trading company.


