IBEX 35 (Spain) index Wave technical analysis [Video]
![IBEX 35 (Spain) index Wave technical analysis [Video]](https://editorial.fxsstatic.com/images/i/Economic-Indicator_Recession-5_XtraLarge.png)
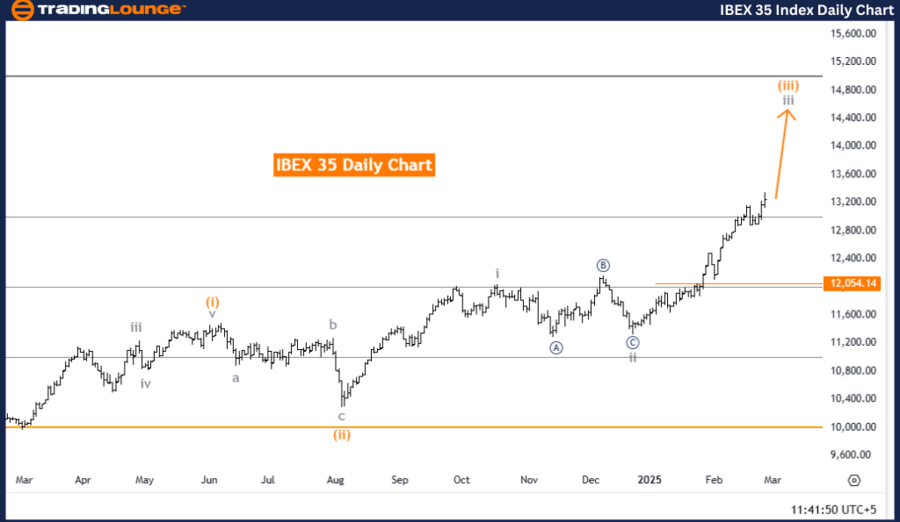
IBEX 35 (Spain) – Elliott Wave Analysis – Trading Lounge Day Chart.
IBEX 35 (Spain) Wave technical analysis
-
Function: Bullish Trend.
-
Mode: Impulsive.
-
Structure: Gray Wave 3.
-
Position: Orange Wave 3.
-
Next lower degree: Gray Wave 4.
-
Wave cancellation level: 12,054.24.
IBEX 35 Elliott Wave analysis overview
The IBEX 35 Elliott Wave Analysis on the day chart highlights a bullish trend, indicating that the market is in an impulsive phase. The current wave structure is Gray Wave 3, which forms part of a larger upward movement within Orange Wave 3. This suggests that strong upward momentum is present, characteristic of an impulsive wave structure. The next anticipated move is Gray Wave 4, expected to develop after the completion of Gray Wave 3.
The previous Gray Wave 2 appears to have concluded, and the market is now progressing through Gray Wave 3 of Orange Wave 3. This wave is expected to continue showing bullish strength, aligning with the impulsive nature of the trend. Traders should closely monitor the development of Gray Wave 3, as its completion will signal the potential start of Gray Wave 4, a corrective phase that may introduce temporary pullbacks or consolidation before the upward trend resumes.
Key Trading Considerations
-
Critical Price Level to Watch: 12,054.24 (Wave Cancellation Level).
-
If IBEX 35 drops below this level, the current wave count is invalidated, requiring a reassessment of the market structure.
-
This level serves as major support, and its breach may indicate a trend reversal or wave pattern shift.
-
-
Market Implications:
-
Completion of Gray Wave 3 → Signals potential entry for Gray Wave 4, introducing a corrective phase.
-
Impulsive Wave Strength → Suggests continued bullish movement until Wave 3 reaches exhaustion.
-
Corrective Phase Awareness → Helps traders prepare for potential retracements before trend continuation.
-
Conclusion
The IBEX 35 market structure currently reflects a strong bullish trend, with Gray Wave 3 developing after the completion of Gray Wave 2. This impulsive movement is part of Orange Wave 3, and the next anticipated move is Gray Wave 4, which is expected to bring a temporary corrective phase before the broader trend resumes.
Traders should closely monitor price action around the 12,054.24 level, as this critical support level acts as a wave validation threshold. If this level holds, the bullish outlook remains intact, but a break below would require reassessing the market wave count.
Understanding Elliott Wave structures is essential for anticipating potential market movements and aligning trading strategies accordingly. By analyzing wave dynamics and price action, traders can make data-driven trading decisions and capitalize on market trends.
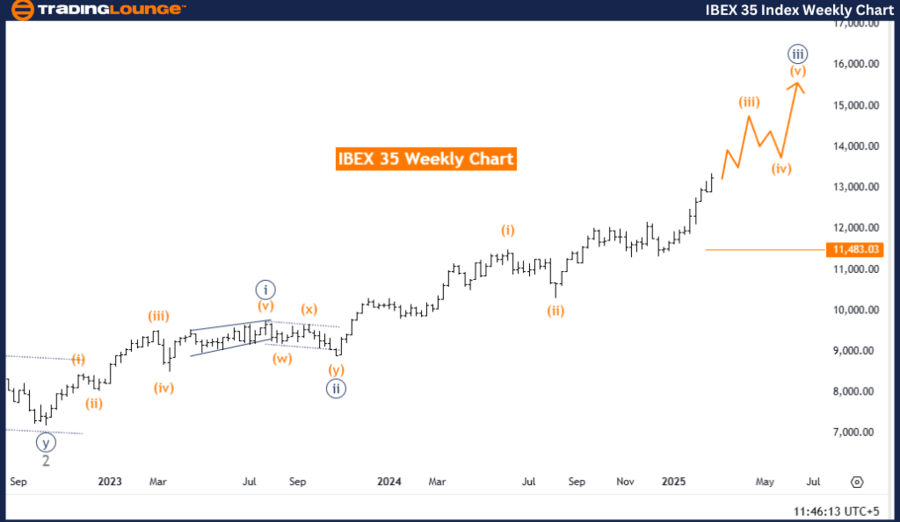
IBEX 35 (Spain) – Elliott Wave Analysis – Trading Lounge Weekly Chart.
IBEX 35 (Spain) Wave technical analysis
-
Function: Bullish Trend.
-
Mode: Impulsive.
-
Structure: Orange Wave 3.
-
Position: Navy Blue Wave 3.
-
Next lower degree: Orange Wave 4.
-
Wave cancellation level: 12,054.24.
IBEX 35 Elliott Wave analysis overview
The IBEX 35 Elliott Wave Analysis on the weekly chart highlights a bullish trend, with the market currently in an impulsive mode. The wave structure is identified as Orange Wave 3, forming part of a larger upward movement within Navy Blue Wave 3. This signals that the market is in a strong bullish phase, characteristic of an impulsive Elliott Wave structure. The next expected movement is Orange Wave 4, which will likely develop after Orange Wave 3 is completed.
The previous Orange Wave 2 appears to have concluded, and the market is now progressing through Orange Wave 3 of 3. This wave is expected to maintain strong upward momentum, consistent with the impulsive nature of the trend. Traders should closely monitor the development of Orange Wave 3, as its completion will signal the potential beginning of Orange Wave 4, a corrective phase that may introduce temporary pullbacks or consolidation before the bullish trend resumes.
Key trading considerations
-
Critical Price Level to Watch: 12,054.24 (Wave Cancellation Level).
-
If IBEX 35 drops below this level, the current wave count becomes invalid, requiring a reassessment of market structure.
-
This level serves as a major support zone, and a break below it may signal a trend reversal or wave pattern shift.
-
-
Market Implications:
-
Completion of Orange Wave 3 → Signals potential entry for Orange Wave 4, introducing a short-term correction.
-
Impulsive Wave Strength → Suggests continued bullish movement until Wave 3 reaches exhaustion.
-
Corrective Phase Awareness → Helps traders prepare for retracements before trend continuation.
-
Conclusion
The IBEX 35 market structure currently reflects a strong bullish trend, with Orange Wave 3 developing after the completion of Orange Wave 2. This impulsive movement is part of Navy Blue Wave 3, and the next anticipated move is Orange Wave 4, which is expected to bring a temporary corrective phase before the broader bullish trend resumes.
Traders should closely monitor price action around the 12,054.24 level, as this critical support level serves as a wave validation threshold. If this level holds, the bullish outlook remains intact, but a break below would require reassessing the Elliott Wave count.
Understanding Elliott Wave structures is essential for anticipating potential market movements and aligning trading strategies accordingly. By analyzing wave patterns and price action, traders can develop a data-driven approach to maximize their market positioning.
Technical analyst: Malik Awais.
IBEX 35 Elliott Wave analysis overview [Video]
Author

Peter Mathers
TradingLounge
Peter Mathers started actively trading in 1982. He began his career at Hoei and Shoin, a Japanese futures trading company.


