IBEX 35 (Spain) index Elliott Wave technical analysis [Video]
![IBEX 35 (Spain) index Elliott Wave technical analysis [Video]](https://editorial.fxsstatic.com/images/i/Equity-Index_IBEX-2_XtraLarge.jpg)
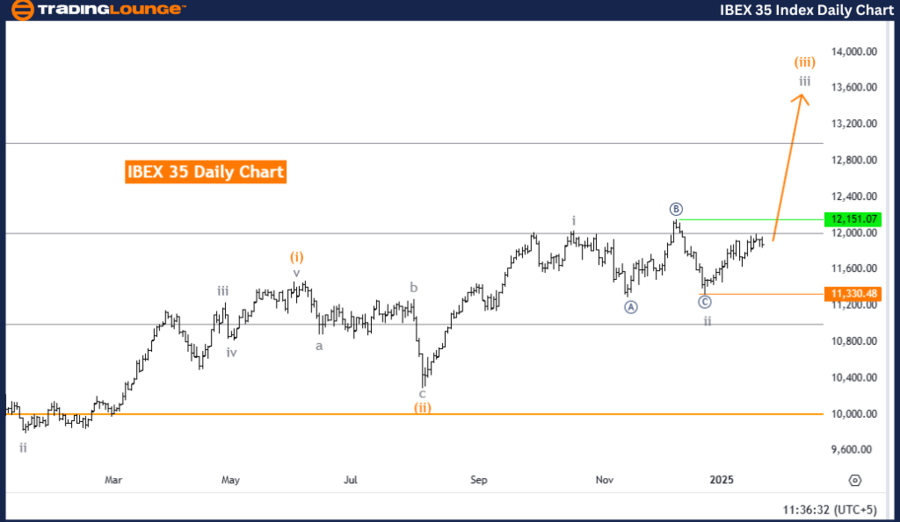
IBEX 35 (Spain) Elliott Wave Analysis Trading Lounge Day Chart.
IBEX 35 (Spain) Elliott Wave technical analysis
-
Function: Bullish Trend.
-
Mode: Impulsive.
-
Structure: Gray wave 3.
-
Position: Orange wave 3.
-
Direction next higher degrees: Gray wave 3 (started).
-
Details: Gray wave 2 appears completed, and gray wave 3 of orange wave 3 is currently in play.
-
Wave cancel invalidation level: 11,330.48.
The analysis of the IBEX 35 index using Elliott Wave Theory on the daily chart highlights a bullish trend with an impulsive mode. The primary focus is on gray wave 3, which has commenced following the apparent completion of gray wave 2. This development signals the continuation of a strong upward movement in the market.
Currently, the index is positioned within orange wave 3, which forms a subwave of the larger gray wave 3 structure. The ongoing progression of orange wave 3 suggests sustained bullish momentum, further strengthening the upward trend. This alignment indicates that gray wave 3, propelled by orange wave 3, is now actively extending the bullish outlook.
The invalidation level for this wave count is set at 11,330.48, serving as a critical threshold. A move below this level would negate the current bullish wave structure, necessitating a reevaluation of the market outlook.
Conclusion
The IBEX 35 daily chart analysis presents a robust bullish outlook, supported by the ongoing development of gray wave 3. The completion of gray wave 2 has provided a foundation for orange wave 3 to sustain upward momentum within the broader structure.
The invalidation level is an essential reference point for assessing the wave count and managing potential risks. This analysis delivers valuable insights into current market trends, assisting traders in aligning their strategies with the prevailing bullish momentum while staying cautious of potential invalidation scenarios.
IBEX 35 (Spain) Elliott Wave Analysis Trading Lounge Weekly Chart
IBEX 35 (Spain) Elliott Wave technical analysis
-
Function: Bullish Trend.
-
Mode: Impulsive.
-
Structure: Gray wave 3.
-
Position: Orange wave 3.
-
Direction next lower degrees: Gray wave 4.
-
Details: Gray wave 2 appears completed, and gray wave 3 of orange wave 3 is currently in play.
-
Wave cancel invalidation level: 11,330.48.
The analysis of the IBEX 35 index using Elliott Wave Theory on the weekly chart identifies a bullish trend characterized by an impulsive mode. The primary focus is on gray wave 3, which has commenced following the completion of gray wave 2, signaling the continuation of a significant upward trend in the market.
Currently, the index is positioned within orange wave 3, forming part of the larger gray wave 3 structure. The ongoing development of orange wave 3 indicates sustained bullish momentum, aligning with the broader upward trend. Upon the completion of gray wave 3, the formation of gray wave 4 is expected, introducing a corrective phase within the larger impulsive structure.
The invalidation level for this wave count is set at 11,330.48, serving as a crucial threshold. A move below this level would invalidate the current bullish wave count, necessitating a reevaluation of the market outlook and wave structure.
Conclusion
The IBEX 35 weekly chart analysis presents a strong bullish outlook, driven by the active development of gray wave 3. The ongoing orange wave 3 continues to reinforce upward momentum following the completion of gray wave 2. The anticipated emergence of gray wave 4 suggests a potential corrective phase before the trend resumes.
The invalidation level is a key reference point for risk management, ensuring consistency with the bullish wave count. This analysis provides traders with valuable insights into market progression, assisting them in aligning their strategies with the prevailing trend while keeping an eye on the invalidation level for potential adjustments.
.png.d87dfbfd23cca55bb529db826589f1ac.png)
Technical analyst: Malik Awais.
IBEX 35 (Spain) Elliott Wave technical analysis [Video]
Author

Peter Mathers
TradingLounge
Peter Mathers started actively trading in 1982. He began his career at Hoei and Shoin, a Japanese futures trading company.


