IBEX 35 (Spain) index Elliott Wave technical analysis [Video]
![IBEX 35 (Spain) index Elliott Wave technical analysis [Video]](https://editorial.fxstreet.com/images/Markets/Equities/Ibex/bolsa-de-madrid-15680575_XtraLarge.jpg)
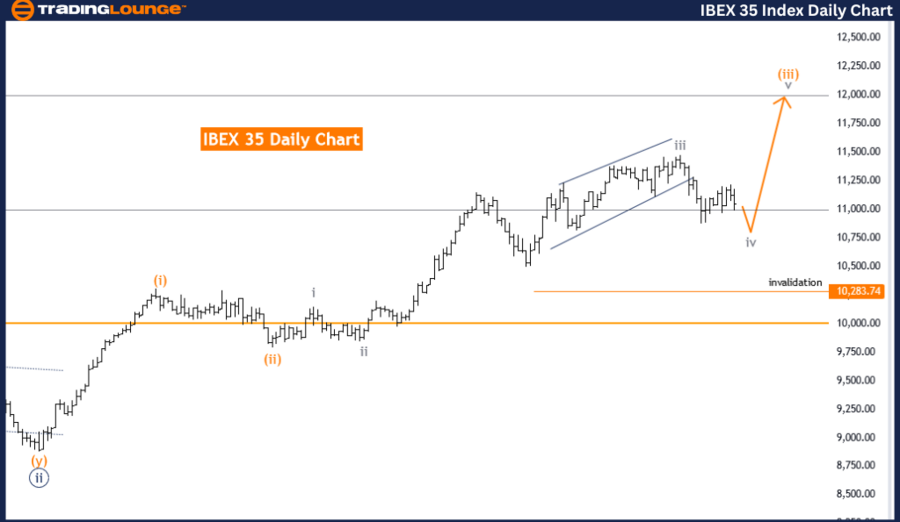
IBEX 35 (Spain) Elliott Wave Analysis Trading Lounge Day Chart.
IBEX 35 (Spain) Elliott Wave technical analysis
Function: Trend.
Mode: Corrective.
Structure: Gray Wave 4.
Position: Orange Wave 3.
Direction next higher degrees: Gray Wave 5.
Details: Gray Wave 3 of 3 looks completed. Now, Gray Wave 4 as a correction is in play. Wave Cancel invalid level: 10283.74.
The IBEX 35 Elliott Wave analysis on the daily chart provides a detailed view of the current market trend using Elliott Wave Theory. The analysis identifies the market as being in a trend within a corrective mode, indicating a corrective phase within the broader trend.
The current market structure is gray wave 4, showing a corrective phase in the larger wave pattern. This suggests a temporary pullback or consolidation after a previous impulsive wave. The market is in orange wave 3, a sub-wave within the gray wave 4 structure, indicating a completed significant upward movement now in a corrective phase.
The next higher degrees direction is focused on gray wave 5, indicating that after the current corrective phase, the market is expected to resume its upward trend. The analysis shows gray wave 3 of 3 is completed, marking the end of a significant impulsive phase. Now, gray wave 4 is acting as a correction.
This corrective phase is crucial as it sets the stage for the next impulsive movement. The wave cancel invalid level, set at 10283.74, is a critical threshold. If breached, it would invalidate the current wave count and require a reevaluation of the Elliott Wave structure. Staying above this level is essential to maintain the current wave pattern's validity.
In summary, the IBEX 35 daily chart analysis shows a trend within a corrective mode, with the market in gray wave 4 of orange wave 3. With gray wave 3 of 3 completed, the market is now in a corrective phase in gray wave 4. The wave cancellation invalid level at 10283.74 is pivotal for sustaining the current wave count and confirming the expected resumption of the upward trend towards gray wave 5.
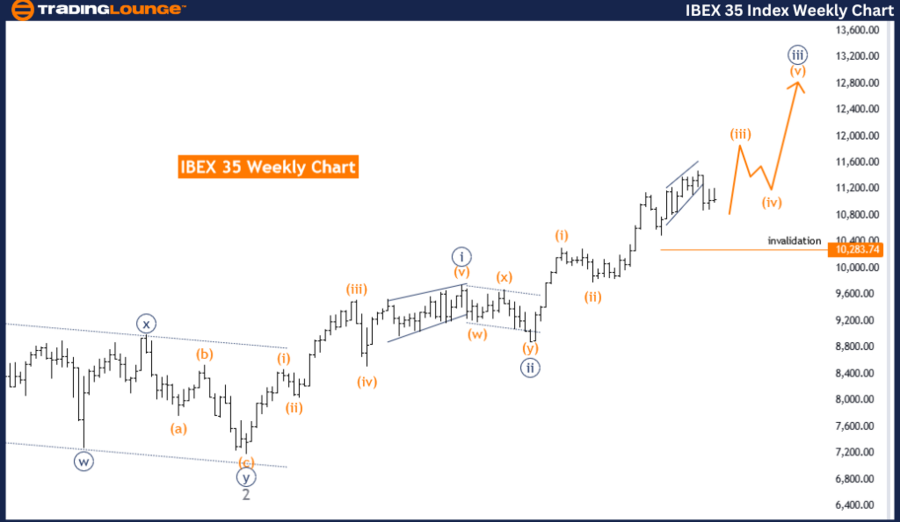
IBEX 35 (Spain) Elliott Wave Analysis Trading Lounge Weekly Chart.
IBEX 35 (Spain) Elliott Wave technical analysis
Function: Trend.
Mode: Impulsive.
Structure: Orange Wave 3.
Position: Navy Blue Wave 3.
Direction next lower degrees: Orange Wave 4.
Details: Orange Wave 3 of 3 is in play. Wave Cancel invalid level: 10283.74.
The IBEX 35 Elliott Wave analysis on the weekly chart provides an in-depth view of the current market trend using Elliott Wave Theory. The analysis identifies the market function as a trend, indicating a strong, directional movement rather than consolidation or correction. The trend is impulsive, suggesting robust, directional momentum.
The market structure is identified as orange wave 3, a significant phase in the Elliott Wave cycle typically denoting a strong, impulsive upward move within the broader trend. Currently, the market is positioned in navy blue wave 3, indicating strong upward momentum.
The direction for the next lower degrees points to orange wave 4, suggesting that after the current impulsive phase, the market will enter a corrective phase. This anticipated shift from the impulsive wave 3 to the corrective wave 4 is crucial for traders as it may present opportunities to adjust trading strategies.
The analysis emphasizes that orange wave 3 of 3 is actively in play. In Elliott Wave Theory, wave 3 of 3 is typically the most powerful and extended wave within the impulsive sequence, indicating a very dynamic and potentially profitable phase for the market.
The wave cancel invalid level is set at 10283.74. This level is critical as it serves as a benchmark; if the market moves below this level, the current wave count would be invalidated, requiring a reanalysis of the wave structure.
In summary, the IBEX 35 weekly chart analysis identifies the market as being in an impulsive trend within orange wave 3 and positioned in navy blue wave 3. The direction for the next lower degrees points to a forthcoming orange wave 4 correction. The market is currently in the powerful phase of orange wave 3 of 3, with a critical wave cancel invalid level at 10283.74 that traders should monitor closely.
Technical analyst: Malik Awais.
IBEX 35 (Spain) Elliott Wave technical analysis [Video]
Author

Peter Mathers
TradingLounge
Peter Mathers started actively trading in 1982. He began his career at Hoei and Shoin, a Japanese futures trading company.


