IBEX 35 (Spain) Elliott Wave technical analysis [Video]
![IBEX 35 (Spain) Elliott Wave technical analysis [Video]](https://editorial.fxstreet.com/images/Markets/Equities/Ibex/madrid-stock-exchange-spain-eu-16703960_XtraLarge.jpg)
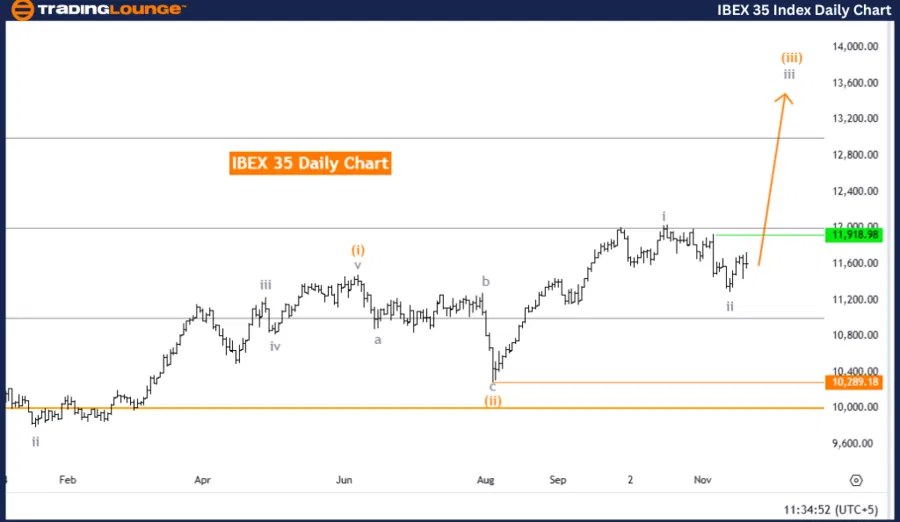
IBEX 35 (Spain) Elliott Wave Analysis Trading Lounge Day Chart.
IBEX 35 (Spain) Elliott Wave technical analysis
-
Function: Bullish Trend.
-
Mode: Impulsive.
-
Structure: Gray wave 3.
-
Position: Orange wave 3.
-
Direction (next higher degrees): Gray wave 3 (started).
-
Details: Gray wave 2 appears completed; gray wave 3 of orange wave 3 is now in progress.
-
Wave cancel invalid level: 10,289.18.
The IBEX 35 daily chart indicates a bullish trend based on Elliott Wave analysis, characterized by an impulsive mode. The focus is on gray wave 3, which has begun unfolding within a broader upward trajectory. The market is currently advancing through orange wave 3, which is propelling the bullish momentum.
The preceding phase, gray wave 2, is believed to have concluded, giving way to gray wave 3 of orange wave 3. This progression suggests further upward movement, driven by robust momentum in line with the ongoing bullish trend. The current phase reflects the continuation of the upward market dynamics.
An invalidation level has been set at 10,289.18. If the market dips below this threshold, the present wave count would be invalidated, requiring a reanalysis of the trend and wave structure.
In summary, the IBEX 35 daily chart presents a bullish scenario, with gray wave 3 actively unfolding in an impulsive manner. The market is advancing through gray wave 3 of orange wave 3, supported by the successful completion of gray wave 2. Traders and investors should closely monitor the invalidation level of 10,289.18 to ensure the consistency of the current Elliott Wave interpretation. This analysis offers critical insights for navigating the ongoing bullish trend in the IBEX 35.
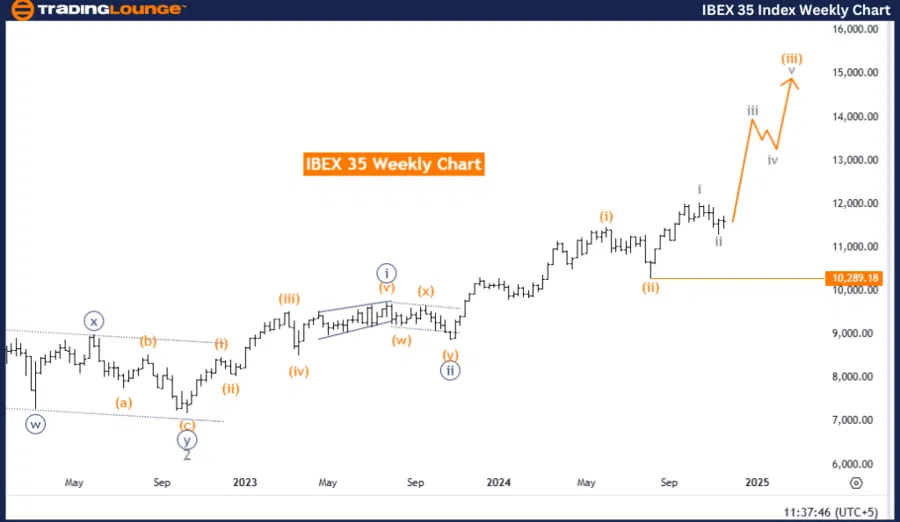
IBEX 35 (Spain) Elliott Wave Analysis Trading Lounge weekly chart.
IBEX 35 (Spain) Elliott Wave technical analysis
-
Function: Bullish Trend.
-
Mode: Impulsive.
-
Structure: Orange wave 3.
-
Position: Navy blue wave 3.
-
Direction (next higher degrees): Orange wave 3 (continue).
-
Details: Orange wave 2 appears completed; orange wave 3 of 3 is now in progress.
-
Wave cancel invalid level: 10,289.18.
The IBEX 35 weekly chart highlights a bullish trend under Elliott Wave analysis, with the current phase exhibiting an impulsive mode. The focus is on orange wave 3, which is driving the upward market movement. Within this broader framework, the market is positioned in navy blue wave 3, contributing to the bullish trajectory.
Following the apparent completion of orange wave 2, the market has transitioned into the next phase, with orange wave 3 of 3 actively unfolding. This phase signifies continued bullish momentum, supported by strong upward market pressure as the wave develops further.
The wave cancellation invalidation level has been established at 10,289.18. Should the price drop below this level, the current wave count would become invalid, necessitating a reassessment of the wave structure and overall trend direction.
In conclusion, the IBEX 35 weekly chart depicts a strong bullish trend with orange wave 3 progressing in an impulsive manner. The completion of orange wave 2 has set the stage for the advancement of orange wave 3 of 3, maintaining the bullish outlook. The invalidation level of 10,289.18 remains a key threshold for ensuring the validity of the current Elliott Wave analysis. This framework offers valuable insights for traders and investors monitoring long-term market dynamics in the IBEX 35.
IBEX 35 (Spain) Elliott Wave technical analysis [Video]
Author

Peter Mathers
TradingLounge
Peter Mathers started actively trading in 1982. He began his career at Hoei and Shoin, a Japanese futures trading company.


