IBEX 35 (Spain) Elliott Wave technical analysis [Video]
![IBEX 35 (Spain) Elliott Wave technical analysis [Video]](https://editorial.fxstreet.com/images/Markets/Equities/Industries/EnergyStocks/electric-power-637435385712017394_XtraLarge.jpg)
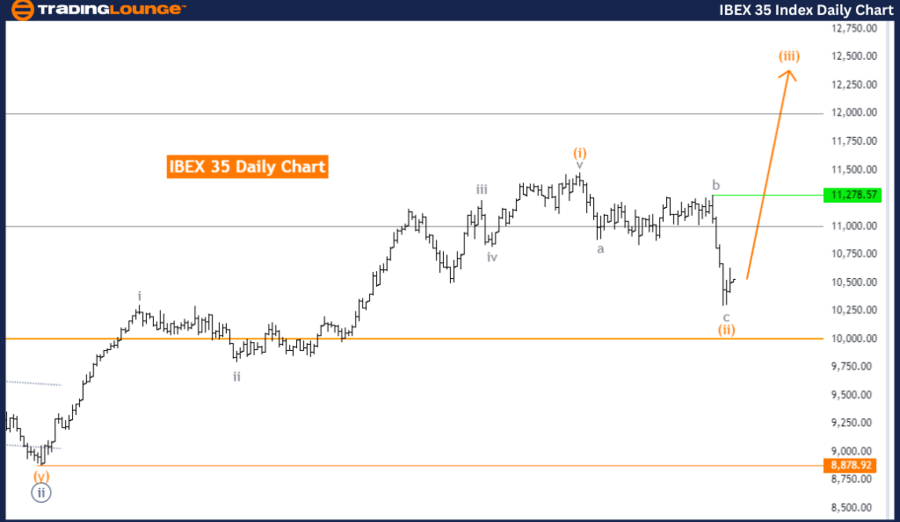
IBEX 35 (Spain) Elliott Wave Analysis Trading Lounge Day Chart.
IBEX 35 (Spain) Elliott Wave technical analysis
Function: Trend.
Mode: Impulsive.
Structure: Orange wave 3.
Position: Navy blue wave 3.
Direction next higher degrees: Orange wave 3 (started).
Details: Orange wave 2 of navy blue wave 3 looking completed. Now orange wave 3 is in play. Wave Cancel invalid level: 8,878.92.
The IBEX 35 Elliott Wave Analysis on the daily chart focuses on a trending market function, characterized by an impulsive mode. This indicates a strong and continuing movement in the trend's direction. The current wave structure under review is the orange wave 3, part of a larger impulsive movement.
The market position is identified as navy blue wave 3, suggesting a significant upward movement within the Elliott Wave framework. The next higher degrees point to the ongoing orange wave 3, indicating this impulsive wave is still progressing and has not yet completed.
A key detail in this analysis is the completion of orange wave 2 of navy blue wave 3. This marks an important transition within the wave structure, signaling the end of the corrective phase of orange wave 2. Consequently, the market has entered orange wave 3, an impulsive wave expected to carry the market higher, in alignment with the overall trend.
The wave cancellation invalid level is set at 8,878.92. This level is crucial for validating the current wave count. If the IBEX 35 falls below this level, it would invalidate the current wave structure, indicating that the anticipated progression from orange wave 2 to orange wave 3 is not occurring as forecasted. This would necessitate a reevaluation of the wave count and a new analysis to understand the market's direction.
Summary: The IBEX 35 Elliott Wave Analysis on the daily chart indicates a strong impulsive trend, currently within navy blue wave 3. The completion of orange wave 2 has led to the commencement of orange wave 3, signifying continued upward movement. The wave cancellation invalid level at 8,878.92 is critical for maintaining the validity of this wave structure and guiding future market expectations.
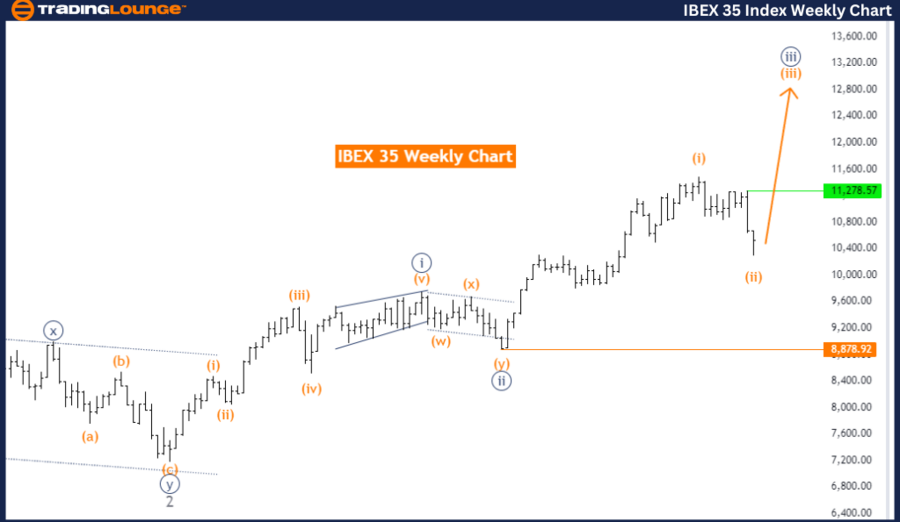
IBEX 35 (Spain) Elliott Wave Analysis Trading Lounge Weekly Chart
IBEX 35 (Spain) Elliott Wave technical analysis
Function: Trend.
Mode: Impulsive.
Sturecture: Orange wave 3.
Position: Navy Blue Wave 3.
Direction next higher degrees: Orange wave 3 (started).
Details: Orange wave 2 of navy blue wave 3 looks completed. Now Orange Wave 3 is in play. Wave Cancel invalid level: 8,878.92.
The IBEX 35 Elliott Wave Analysis on the weekly chart focuses on a trending market function with an impulsive mode. This analysis indicates a strong and continuous upward movement in the market. The specific wave structure under observation is orange wave 3, which is part of a larger impulsive pattern.
Currently, the market is positioned in navy blue wave 3, suggesting a significant rise as part of the broader trend. The direction of the next higher degrees points to the ongoing orange wave 3, indicating that this impulsive wave has started and is still progressing.
A critical detail in this analysis is the completion of orange wave 2 of navy blue wave 3. This completion marks an important transition within the wave structure, signifying the end of the corrective phase of orange wave 2. Consequently, the market has now entered orange wave 3, an impulsive wave expected to drive the market higher in alignment with the overall trend.
The wave cancel invalid level is set at 8,878.92. This level is essential for validating the current wave count. If the IBEX 35 were to fall below this level, it would invalidate the existing wave structure, indicating that the anticipated progression from orange wave 2 to orange wave 3 is not occurring as expected. This scenario would require a reevaluation of the wave count and a fresh analysis to understand the market's direction.
Summary: The IBEX 35 Elliott Wave Analysis on the weekly chart highlights a market in a strong impulsive trend, currently within navy blue wave 3. The completion of orange wave 2 has led to the beginning of orange wave 3, suggesting continued upward movement. The wave cancellation invalid level at 8,878.92 is crucial for maintaining the validity of this wave structure and guiding future market expectations.
Technical analyst: Malik Awais.
IBEX 35 (Spain) Elliott Wave technical analysis [Video]
Author

Peter Mathers
TradingLounge
Peter Mathers started actively trading in 1982. He began his career at Hoei and Shoin, a Japanese futures trading company.


