IBEX 35 Index Elliott Wave technical analysis [Video]
![IBEX 35 Index Elliott Wave technical analysis [Video]](https://editorial.fxstreet.com/images/Markets/Equities/Industries/EnergyStocks/electric-power-637435385712017394_XtraLarge.jpg)
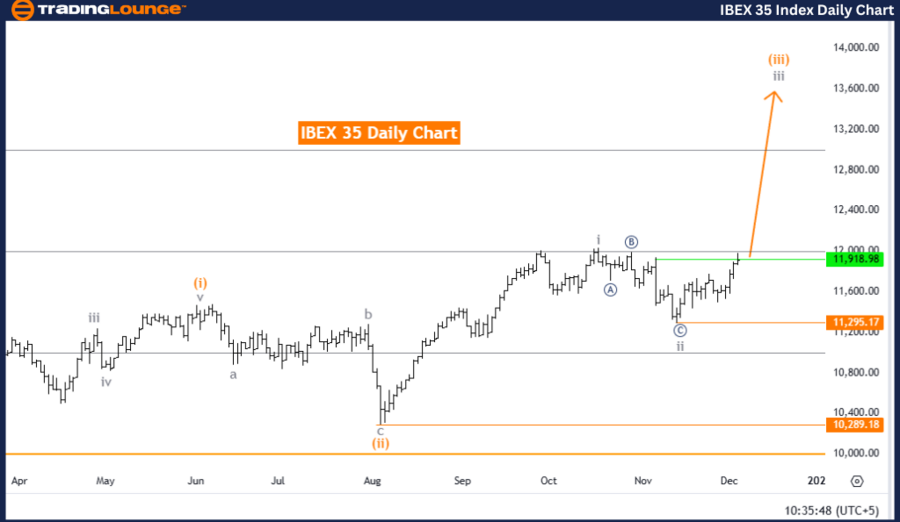
IBEX 35 (Spain) Elliott Wave Analysis Trading Lounge Day Chart.
IBEX 35 Daily Chart Analysis.
IBEX 35 Elliott Wave technical analysis
-
Function: Bullish Trend.
-
Mode: Impulsive.
-
Structure: Gray Wave 3.
-
Position: Orange Wave 3.
-
Direction (next higher degrees): Gray Wave 3 (Initiated).
-
Details: Gray Wave 2 appears completed, and Gray Wave 3 within Orange Wave 3 is in progress.
-
Wave cancel invalidation level: 11,295.17.
Analysis overview
The daily chart for IBEX 35 presents Elliott Wave analysis indicating a bullish trend. The current wave structure identifies Gray Wave 3, which forms part of an impulsive sequence. Within this structure, Orange Wave 3 is advancing, signaling sustained upward momentum.
Wave analysis and progression
-
Completion of Gray Wave 2: The analysis suggests that Gray Wave 2 has likely concluded, marking the start of Gray Wave 3 within Orange Wave 3. This phase aligns with Elliott Wave Theory, which uses wave patterns to project market movements.
-
Development of Gray Wave 3: The impulsive nature of this wave indicates a strong bullish phase with potential for further gains as the market progresses.
Invalidation level
-
A critical invalidation level is identified at 11,295.17. If the market moves below this threshold, the current wave structure would need reassessment, potentially indicating a shift away from the expected bullish scenario.
Trading insights
This analysis provides traders with a comprehensive framework to interpret the bullish momentum within the IBEX 35 market. By emphasizing key levels and directional trends, it outlines the continuation of the upward trajectory as the impulsive wave structure unfolds. The invalidation level serves as a critical marker for monitoring potential changes in market direction.
For traders, this detailed wave analysis offers actionable insights into probable market behavior, supporting informed trading strategies in line with Elliott Wave principles.
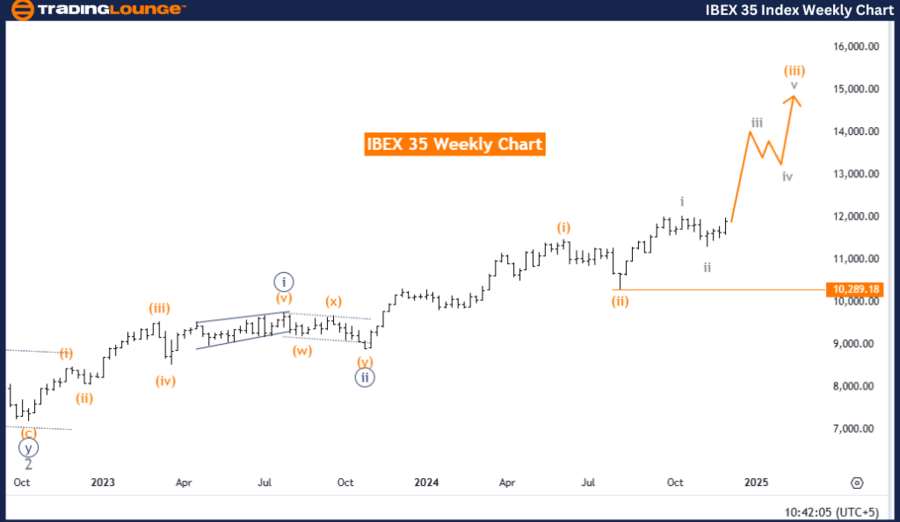
IBEX 35 (Spain) Elliott Wave Analysis Trading Lounge Weekly Chart.
IBEX 35 Weekly Chart Analysis.
IBEX 35 Elliott Wave technical analysis
-
Function: Bullish Trend.
-
Mode: Impulsive.
-
Structure: Gray Wave 3.
-
Position: Orange Wave 3.
-
Direction (next higher degrees): Gray Wave 3 (Initiated).
-
Details: Gray Wave 2 appears completed, and Gray Wave 3 within Orange Wave 3 is in progress.
-
Wave cancel invalidation level: 10,289.18.
Analysis overview
The weekly chart for IBEX 35 presents Elliott Wave analysis highlighting a bullish trend. The current wave structure identifies Gray Wave 3, which is part of a larger impulsive sequence. Within this framework, Orange Wave 3 is advancing, signaling a continuation of the upward trajectory.
Wave analysis and progression
-
Completion of Gray Wave 2: The analysis indicates that Gray Wave 2 has likely concluded, leading to the progression of Gray Wave 3 within Orange Wave 3. This development aligns with Elliott Wave Theory, which utilizes wave patterns to forecast market movements.
-
Development of Gray Wave 3: The ongoing impulsive movement reflects a robust bullish phase, with potential for further gains as the wave unfolds.
Invalidation level
-
An invalidation level is set at 10,289.18. If the market falls below this threshold, the current wave structure would need reevaluation, possibly signaling a deviation from the anticipated bullish outlook.
Trading insights
This analysis offers traders a comprehensive framework to interpret the IBEX 35’s bullish momentum. By emphasizing critical levels and directional trends, it highlights the continuation of the upward movement as the impulsive wave structure develops. The invalidation level provides a key reference point for monitoring potential changes in market dynamics.
For traders, the detailed examination of Gray Wave 3 offers actionable insights for informed decision-making, consistent with Elliott Wave principles.
IBEX 35 Elliott Wave Technical Analysis [Video]
Author

Peter Mathers
TradingLounge
Peter Mathers started actively trading in 1982. He began his career at Hoei and Shoin, a Japanese futures trading company.


