IAG stock analysis [Video]
![IAG stock analysis [Video]](https://editorial.fxstreet.com/images/Markets/Equities/Industries/Software/pic-laptop-screen-637435355891636339_XtraLarge.jpg)
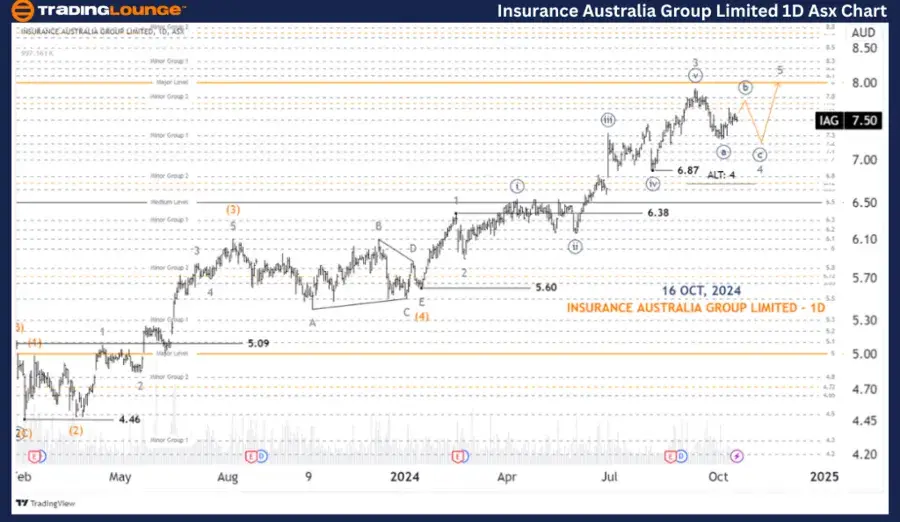
ASX: INSURANCE AUSTRALIA GROUP LIMITED – IAG Elliott Elliott Wave Technical Analysis TradingLounge (1D Chart)
Greetings, Our Elliott Wave analysis today updates the Australian Stock Exchange (ASX) with INSURANCE AUSTRALIA GROUP LIMITED – IAG. We see IAG about to move up with wave 5-grey, but it will take a little more time for wave 4-grey to complete.
ASX: Insurance Australia Group Limited – IAG one-day chart (semilog scale) analysis
Function: Major trend (Intermediate degree, orange).
Mode: Motive.
Structure: Impulse.
Position: Wave 4-grey of Wave (5)-orange.
Details: Wave 4-grey seems to be unfolding to push lower, it could target around 6.87. Then wave 5-grey could come back to push higher, aiming for even higher levels.
Invalidation point: 6.38.
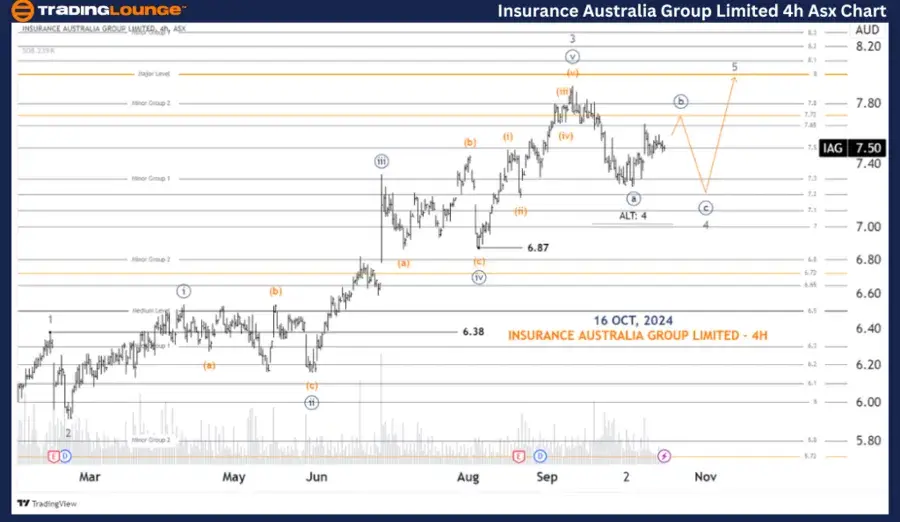
ASX: Insurance Australia Group Limited – IAG four-hour chart analysis
Function: Major trend (Minor degree, grey).
Mode: Motive.
Structure: Impulse.
Position: Wave ((b))-navy of Wave 4-grey.
Details: Looking more closely at the 4-grey wave, I think the first leg of the Zigzag pattern is done and labeled wave ((a)), so there is still a second leg, which will push further down with ((c))-navy. I don't think the 4-grey wave is done, but it is likely to continue for a while longer.
Invalidation point: 6.38.
Conclusion
Our analysis, forecast of contextual trends, and short-term outlook for ASX: INSURANCE AUSTRALIA GROUP LIMITED – IAG aim to provide readers with insights into the current market trends and how to capitalize on them effectively. We offer specific price points that act as validation or invalidation signals for our wave count, enhancing the confidence in our perspective. By combining these factors, we strive to offer readers the most objective and professional perspective on market trends.
Technical analyst: Hua (Shane) Cuong, CEWA-M (Master’s Designation).
ASX: Insurance Australia Group Limited – IAG four-hour chart analysis [Video]
Author

Peter Mathers
TradingLounge
Peter Mathers started actively trading in 1982. He began his career at Hoei and Shoin, a Japanese futures trading company.


