Huya Live is a Chinese video live streaming service. The site is one of the largest of its kind in China. Globally, it operates as Nimo TV. The primary focus of the service is on video game live streaming. Also, it broadcasts other genres like traditional sports, cooking and other streams. Huya Live has been launched 2014 by YY.com which is a subsidiary of JOYY Inc. Today, the majority vote of Huya Live belongs to Tencent with minority to JOYY. One can trade the stock of the company under the ticker $HUYA at Nasdaq.

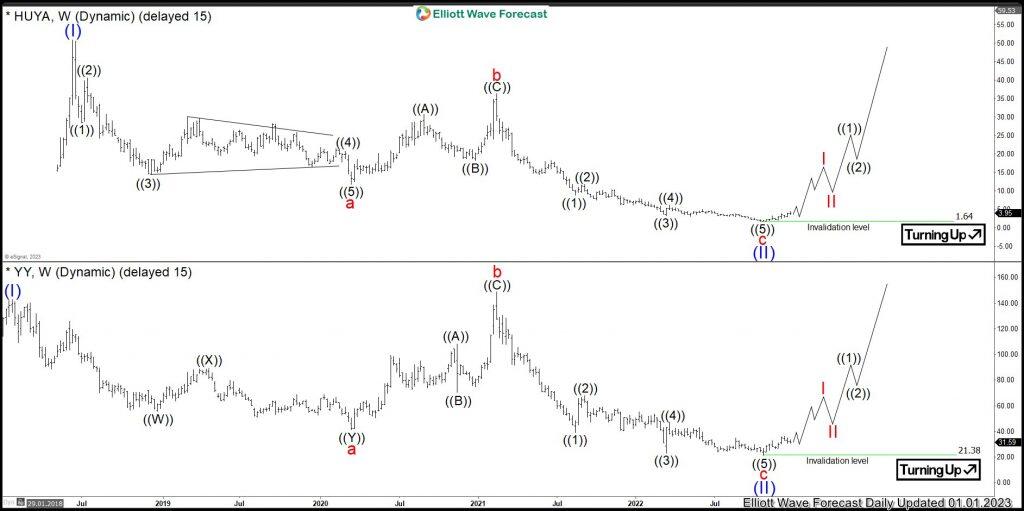
Huya weekly Elliott Wave analysis 1.3.2023

The upper part of the weekly chart below shows the Huya Live shares $HUYA traded at Nasdaq. From the lows, the stock price has developed an initial cycle higher in blue wave (I) of super cycle degree towards 80.82 all-time highs in June 2018. From there, a correction lower in blue wave (II) is unfolding as an Elliott wave zigzag pattern being 5-3-5 structure.

Firstly, red wave a of blue wave (II) has printed a low at 11.78 in March 2020. Then, a bounce has set a connector wave b at 36.33 highs in February 2021. Later on, the price has broken 11.78 lows opening up a bearish sequence. However, 100% extension of the wave c based on the length of the wave a is in the negative area. Obviously, it cannot be reached. Based on both the RSI readings and price action, $HUYA might have ended red wave c of blue wave (II) at 1.64 lows in October 2022. While above there, a new bullish cycle in blue wave (III) might have started and is now in the initial stages. The target for wave (III) will be 52.61-84.07 area and even higher.

Joyy weekly Elliott Wave analysis 1.3.2023

For comparison, the lower part of the weekly chart below shows the JOYY Inc. shares $YY traded at Nasdaq. From the lows, the stock price has developed an initial cycle higher in blue wave (I) of super cycle degree towards 142.97 highs in January 2018. From there, a correction lower in blue wave (II) is unfolding as an Elliott wave expanded flat structure being 3-3-5 structure.

Firstly, red wave a of blue wave (II) has printed a low at 41.33 in March 2020. Then, a bounce has set a connector wave b at 148.88 new all-time highs in February 2021. Later on, the price has broken 41.33 lows confirming the expanded flat structure. Similar to $HUYA, both the RSI readings and price action favor the low of wave (II) to be in place at 21.38 lows in October 2022. While above there, wave (III) can reach towards 165.06-235.91 area and even higher.

One can see how the expanded flat structure in $YY correlates with  the zigzag structure in the $HUYA and how the end of the flat in JOYY Inc. can mean the end of the zigzag correction in the stock of Huya Live.

Chart

Share: Feed news

FURTHER DISCLOSURES AND DISCLAIMER CONCERNING RISK, RESPONSIBILITY AND LIABILITY Trading in the Foreign Exchange market is a challenging opportunity where above average returns are available for educated and experienced investors who are willing to take above average risk. However, before deciding to participate in Foreign Exchange (FX) trading, you should carefully consider your investment objectives, level of xperience and risk appetite. Do not invest or trade capital you cannot afford to lose. EME PROCESSING AND CONSULTING, LLC, THEIR REPRESENTATIVES, AND ANYONE WORKING FOR OR WITHIN WWW.ELLIOTTWAVE- FORECAST.COM is not responsible for any loss from any form of distributed advice, signal, analysis, or content. Again, we fully DISCLOSE to the Subscriber base that the Service as a whole, the individual Parties, Representatives, or owners shall not be liable to any and all Subscribers for any losses or damages as a result of any action taken by the Subscriber from any trade idea or signal posted on the website(s) distributed through any form of social-media, email, the website, and/or any other electronic, written, verbal, or future form of communication . All analysis, trading signals, trading recommendations, all charts, communicated interpretations of the wave counts, and all content from any media form produced by www.Elliottwave-forecast.com and/or the Representatives are solely the opinions and best efforts of the respective author(s). In general Forex instruments are highly leveraged, and traders can lose some or all of their initial margin funds. All content provided by www.Elliottwave-forecast.com is expressed in good faith and is intended to help Subscribers succeed in the marketplace, but it is never guaranteed. There is no “holy grail” to trading or forecasting the market and we are wrong sometimes like everyone else. Please understand and accept the risk involved when making any trading and/or investment decision. UNDERSTAND that all the content we provide is protected through copyright of EME PROCESSING AND CONSULTING, LLC. It is illegal to disseminate in any form of communication any part or all of our proprietary information without specific authorization. UNDERSTAND that you also agree to not allow persons that are not PAID SUBSCRIBERS to view any of the content not released publicly. IF YOU ARE FOUND TO BE IN VIOLATION OF THESE RESTRICTIONS you or your firm (as the Subscriber) will be charged fully with no discount for one year subscription to our Premium Plus Plan at $1,799.88 for EACH person or firm who received any of our content illegally through the respected intermediary’s (Subscriber in violation of terms) channel(s) of communication.

Recommended content


Recommended content

Editors’ Picks

Gold: Trade war fears lift Gold to new record high

Gold: Trade war fears lift Gold to new record high

Gold shined as the go-to safe-haven asset amid growing fears over a deepening global trade war. US tariff announcements and key employment data could lift XAU/USD’s volatility. The technical outlook points to overbought conditions in the near term.

Gold News
EUR/USD: US Dollar to fall further despite ruling uncertainty

EUR/USD: US Dollar to fall further despite ruling uncertainty

The EUR/USD pair remained under selling pressure for a second consecutive week but ended it little changed at around 1.0820. The US Dollar remained trapped between tariff-related concerns and tepid US data, limiting its safe-haven condition.


EUR/USD News
GBP/USD picks up pace and retests 1.2960

GBP/USD picks up pace and retests 1.2960

GBP/USD now capitalises on the Greenback's knee-jerk and advances to the area of daily peaks in the 1.2960-1.2970 band, helped at the same time by auspicious results from UK Retail Sales.

GBP/USD News
Week ahead: US NFP and Eurozone CPI awaited as tariff war heats up, RBA meets

Week ahead: US NFP and Eurozone CPI awaited as tariff war heats up, RBA meets

Trump’s reciprocal tariffs could spur more chaos. US jobs report might show DOGE impact on labour market. Eurozone inflation will be vital for ECB bets as April cut uncertain. RBA to likely hold rates; Canadian jobs, BoJ Tankan survey also on tap.

Read more
US: Trump's 'Liberation day' – What to expect?

US: Trump's 'Liberation day' – What to expect?

Trump has so far enacted tariff changes that have lifted the trade-weighted average tariff rate on all US imports by around 5.5-6.0%-points. While re-rerouting of trade will decrease the effectiveness of tariffs over time, the current level is already close to the highest since the second world war. 

Read more
The Best brokers to trade EUR/USD

The Best brokers to trade EUR/USD

SPONSORED Discover the top brokers for trading EUR/USD in 2025. Our list features brokers with competitive spreads, fast execution, and powerful platforms. Whether you're a beginner or an expert, find the right partner to navigate the dynamic Forex market.

Read More

Forex MAJORS

Cryptocurrencies

Signatures

Best Brokers of 2025