![]() Elliott Wave Forecast Team
Elliott Wave Forecast Team
ElliottWave-Forecast.com
CrowdStrike Holdings, Inc. (CRWD) is an American cybersecurity technology company based in Austin, Texas. It provides cloud workload and endpoint security, threat intelligence, and cyberattack response services.
CrowdStrike (CRWD) July 2021 daily chart
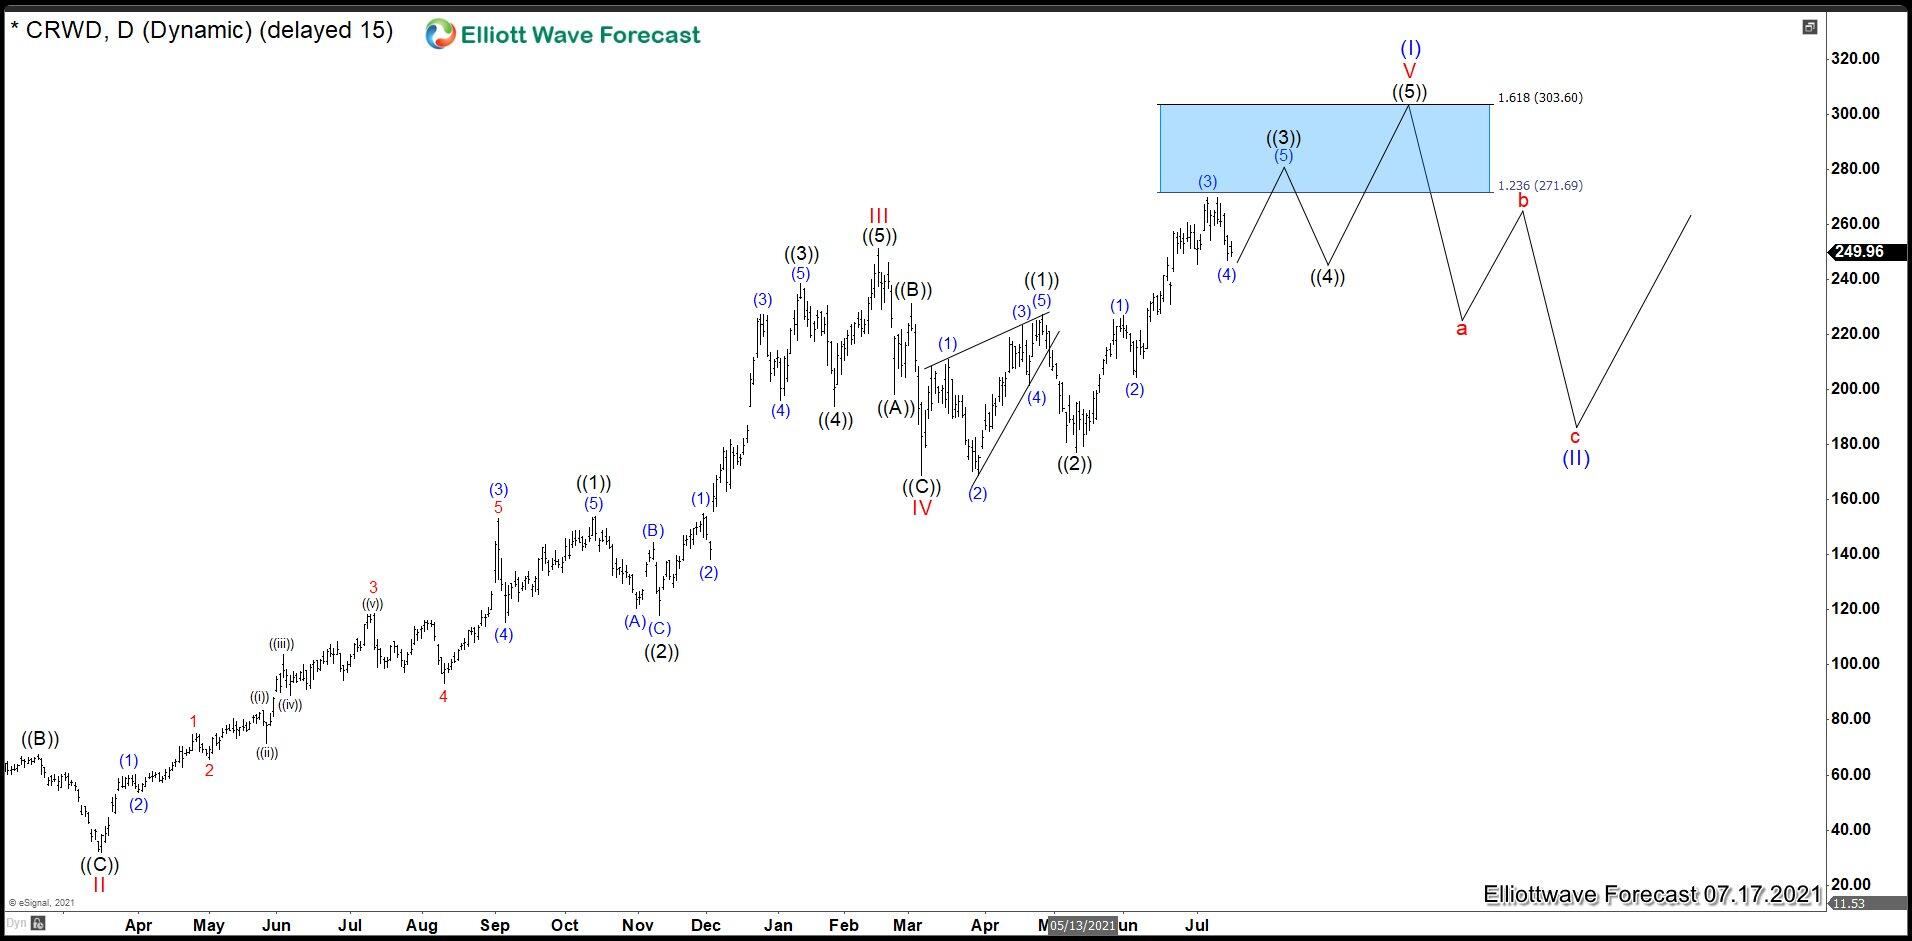
On July 22nd, we analyzed CRWD showing an structure suggesting that a very important market cycle was near to end; that is, the whole cycle from its foundation in 2011. We were expecting to peak after 5 waves up from 168.67 wave IV low and we provided a blue box area in 271.69 – 303.60 as possible zone to finish this Super Cycle and start a huge pullback.
CrowdStrike (CRWD) November 2021 daily chart
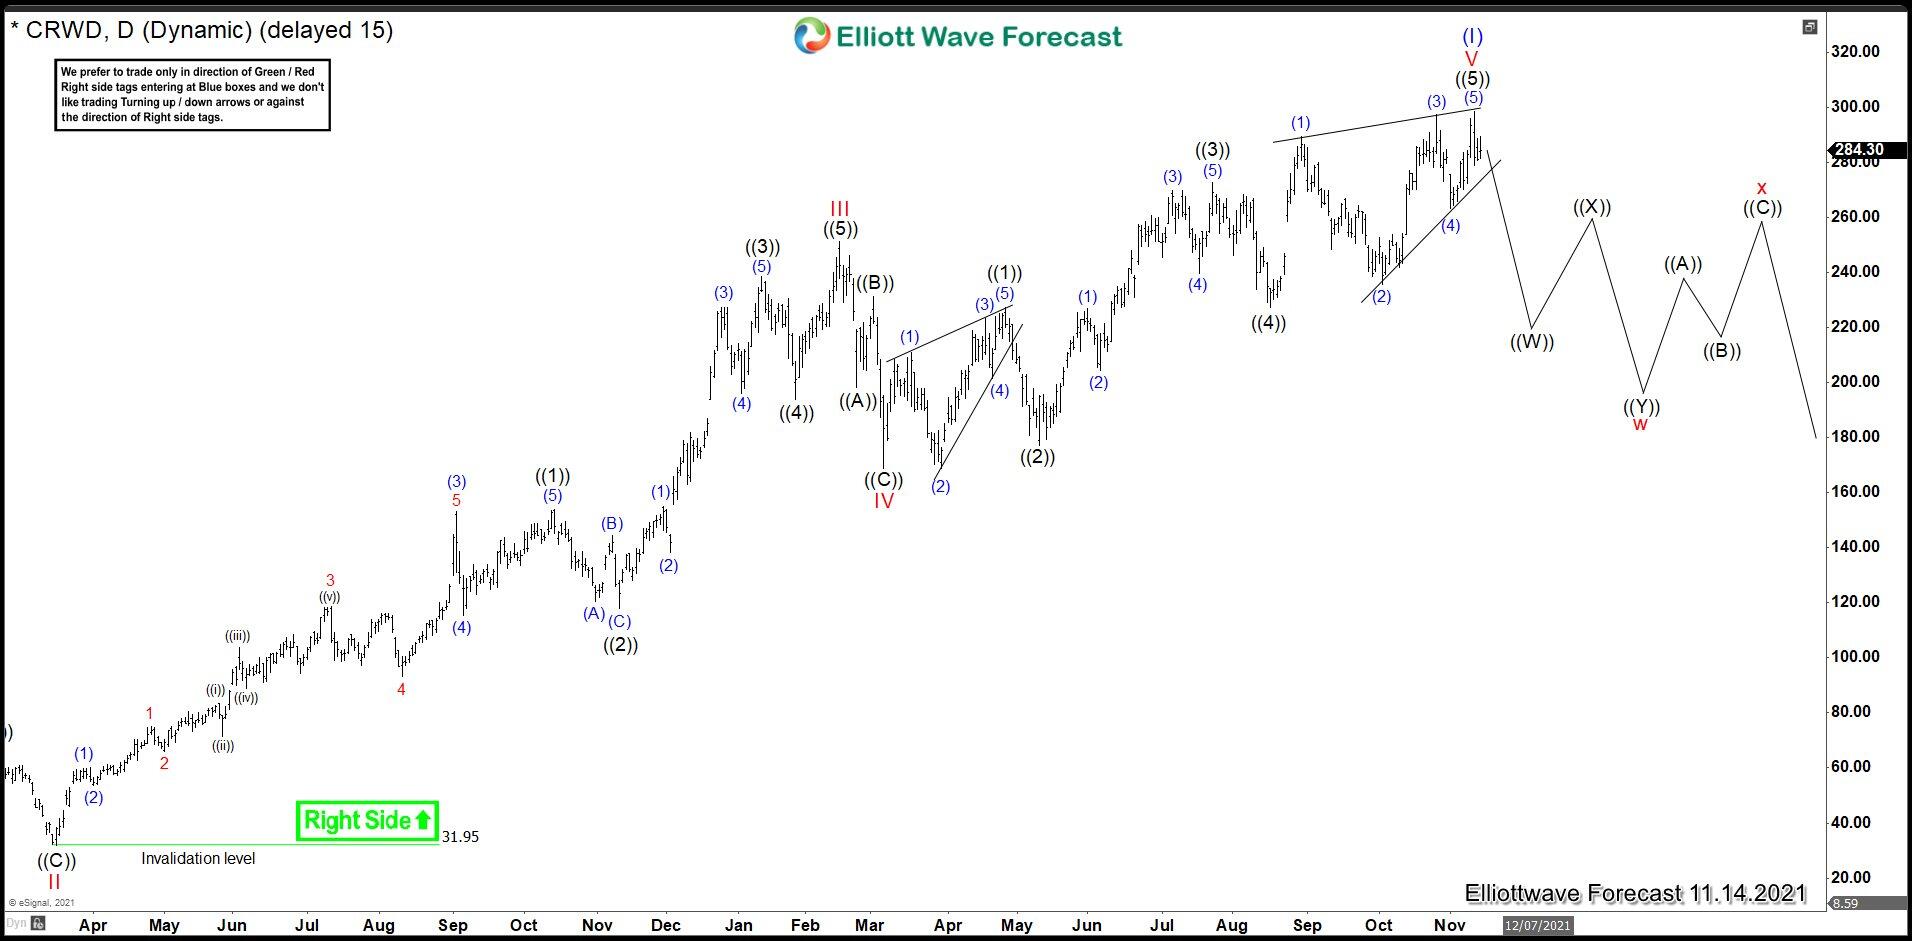
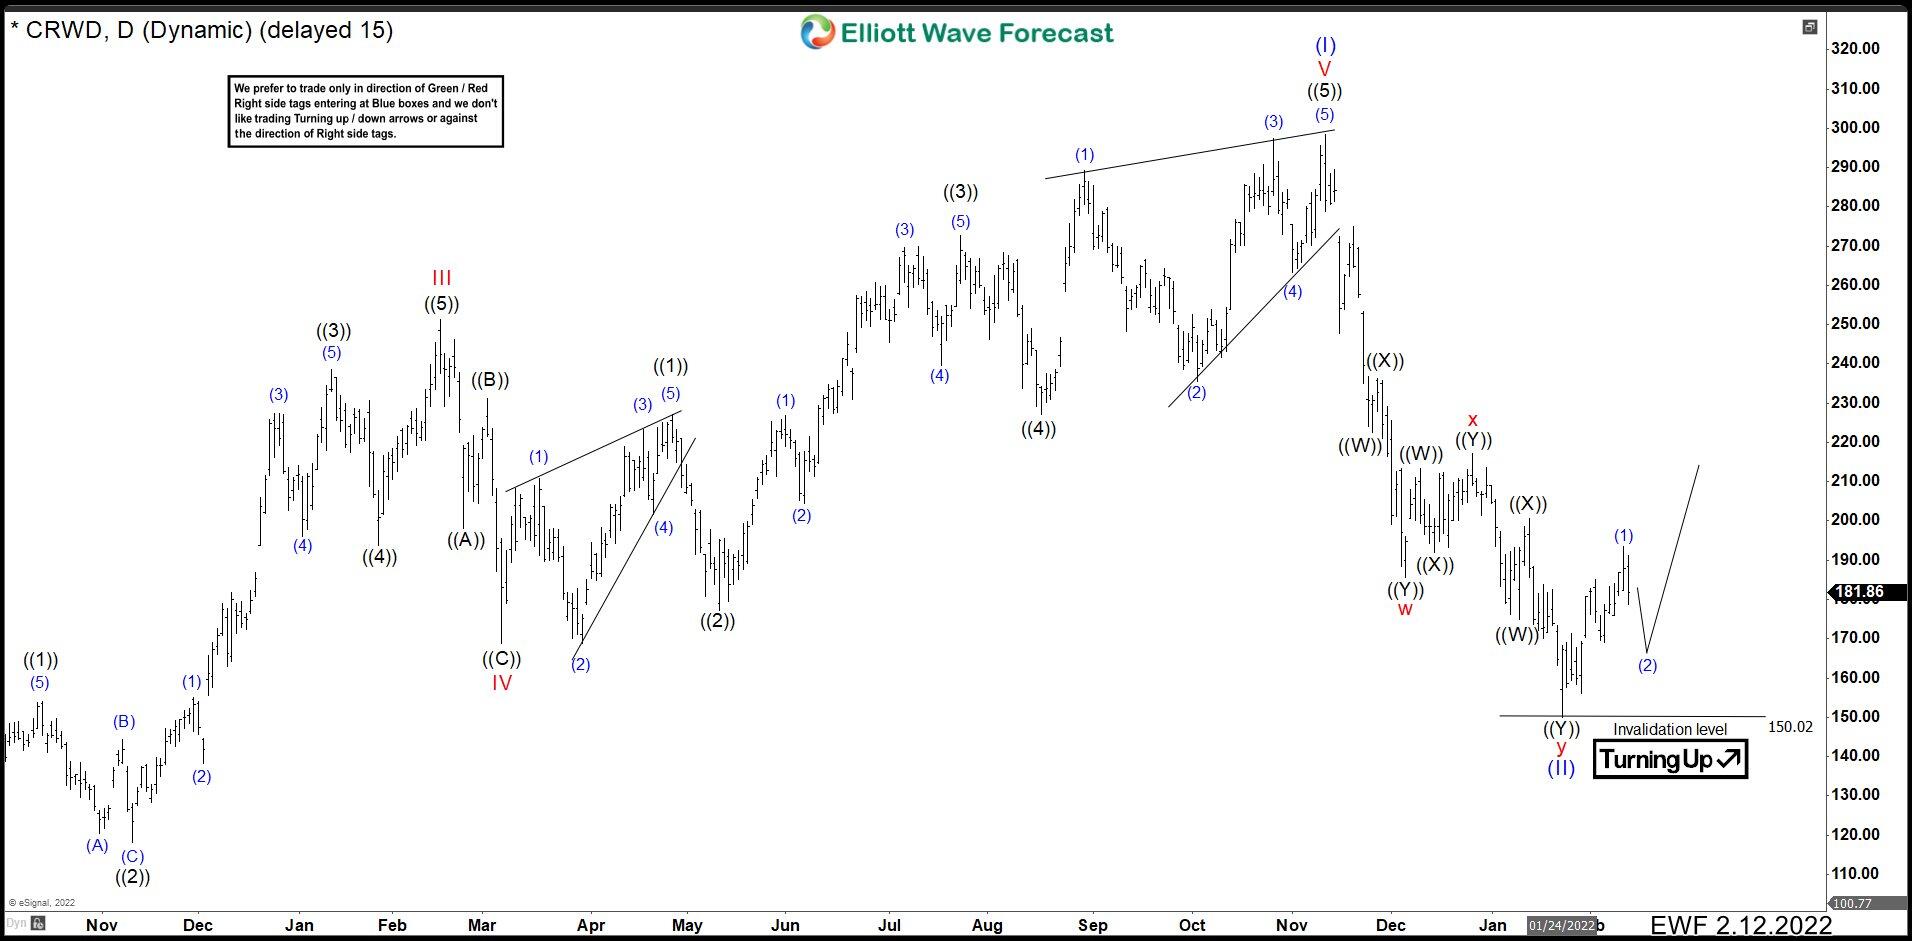
In November, the structure of CRWD had enough swings to think that 5 waves impulse and the Super Cycle had ended. The impulse started with wave I ended at 101.800 on 2019, the wave II pullback finished at 31.95 on March 2020 with the pandemic drop. From there the rally continued and wave III ended at 251.28 and a corrective wave as IV completed at 168.67. In this point, the last push to complete wave V higher began, and as expected CRWD made 5 swings up being the last wave ((5)) of (V) an ending diagonal. The cycle ended at 298.48 inside our possible target area 271.69 – 303.60 and we were expecting a very important drop in the stock.
CrowdStrike (CRWD) December 2021 daily chart
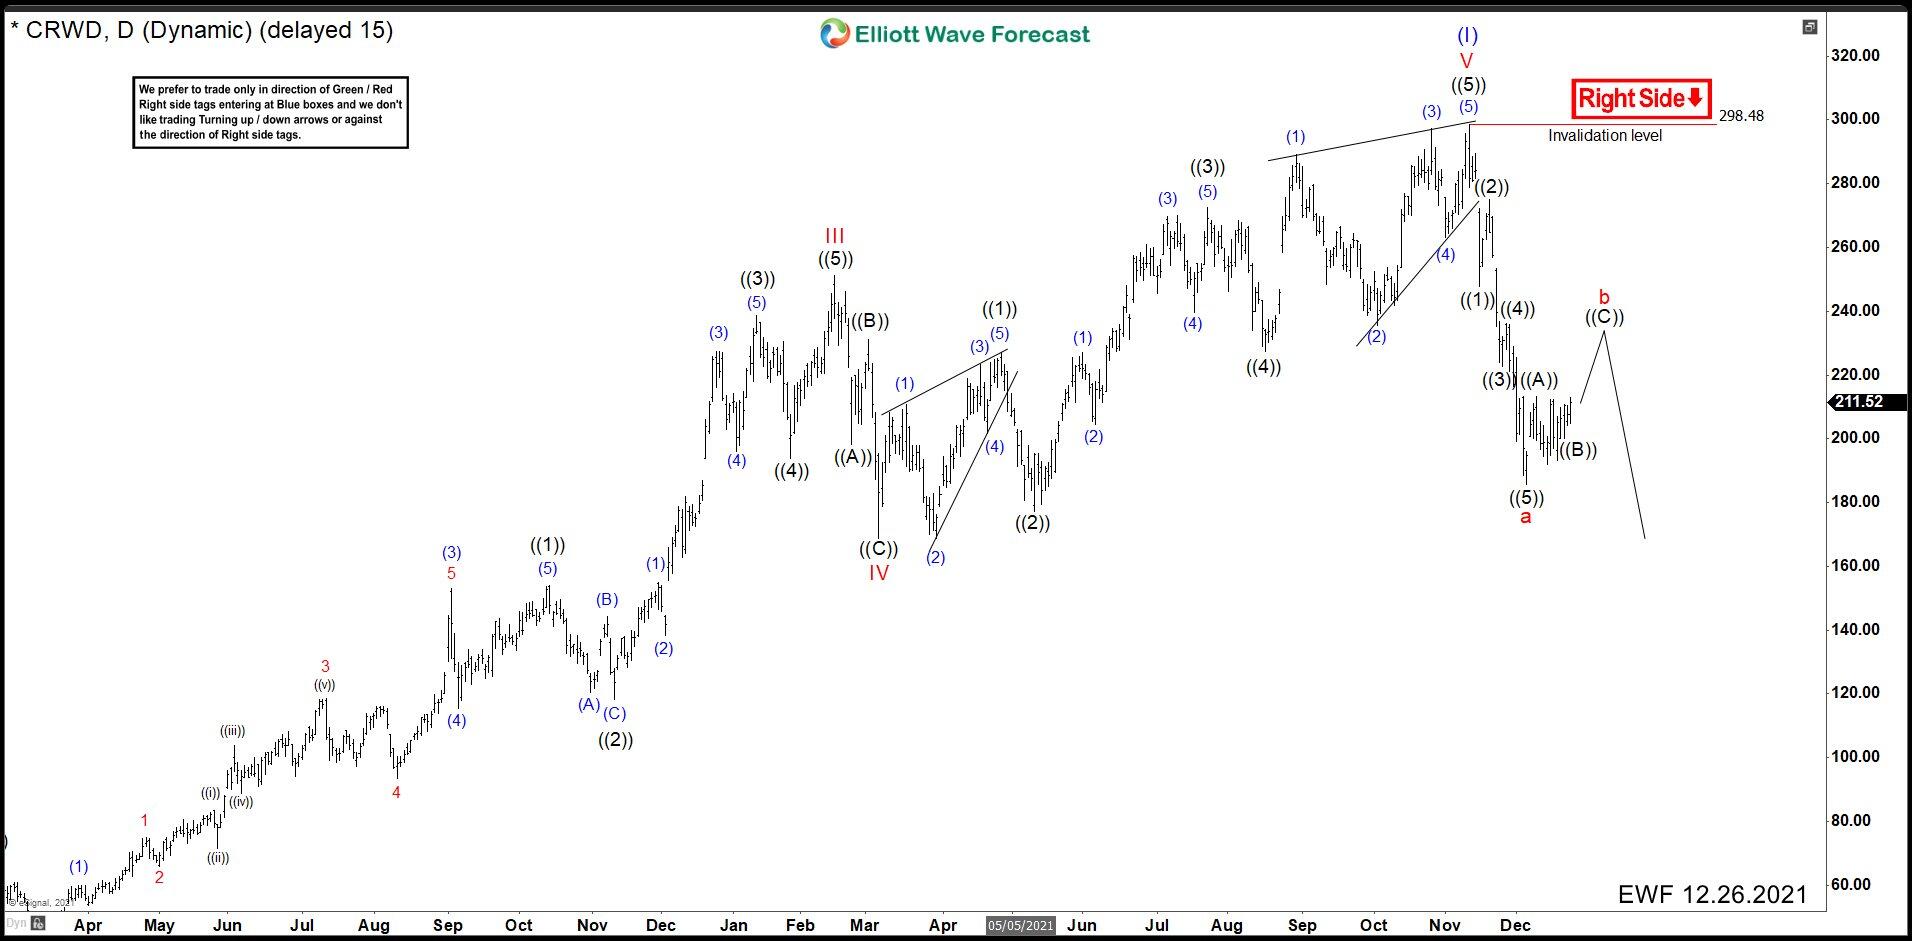
The dip was very strong and in 3 weeks CRWD hit 185.71 losing 37.78%. We change our first view for a possible wxy correction to an abc correction and marked an impulse structure from the top ending wave “a” at 185.71. We suggested a pullback in wave “b” before continuing with the downtrend.
CrowdStrike (CRWD) January daily chart
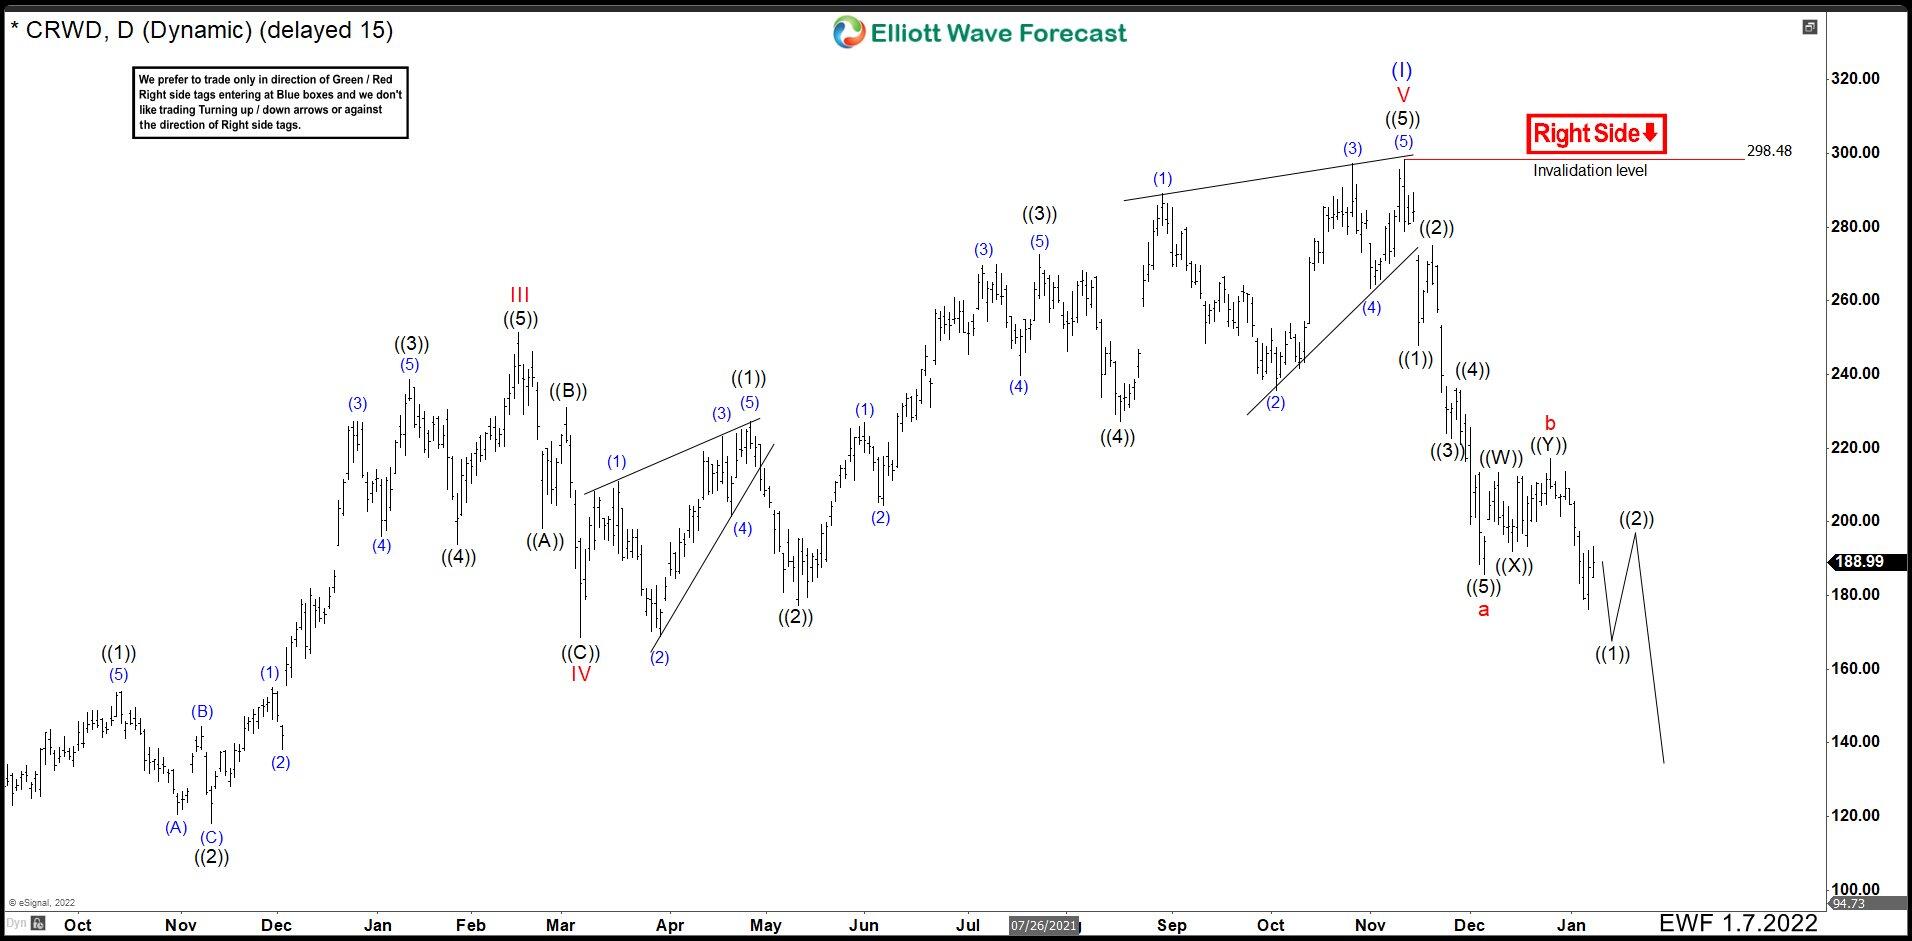
The corrective wave “b” was small ending at 217.11 and CRWD kept dropping. Therefore, we began to build the next impulse to complete wave “c” the last one of the abc correction and finish the whole correction as wave (II). We were calling one more low to end wave ((1)) and an correction as wave ((2)) to then see further downside in the stock.
CrowdStrike (CRWD) February 12th daily chart
After 3 swings down from wave “b”, CRWD bounced from 150.02 and the rally were stronger that we thought. That made us to return to the original plan of a wxy correction and we labeled the fall in that way, given the end of the wxy structure and wave (II) at 150.02. From here, the rally looks like as a leading diagonal ending the wave (1) at 193.40. Currently, we are developing wave (2) pullback and as we stay above 150.02 we should continue with the rally.
To conclude, there is still a probability to see 3 swings more down in CRWD. That is a ((W)), ((X)), ((Y)) structure from wave “b”. Wave ((W)) could have ended at 150.02 then wave ((X)) ended at 193.40 and we need 3 swings more to complete the fractal and the corrective wave (II). Thus, we are looking to complete wave (2) and continuing with the rally as we stay above 150.02. In case the invalidation level gives up, we could continue down to 110.90 – 126.64 area in 3 swings more and from there resume the rally. This is a nice possibility for a long-term trade in this stock.
FURTHER DISCLOSURES AND DISCLAIMER CONCERNING RISK, RESPONSIBILITY AND LIABILITY Trading in the Foreign Exchange market is a challenging opportunity where above average returns are available for educated and experienced investors who are willing to take above average risk. However, before deciding to participate in Foreign Exchange (FX) trading, you should carefully consider your investment objectives, level of xperience and risk appetite. Do not invest or trade capital you cannot afford to lose. EME PROCESSING AND CONSULTING, LLC, THEIR REPRESENTATIVES, AND ANYONE WORKING FOR OR WITHIN WWW.ELLIOTTWAVE- FORECAST.COM is not responsible for any loss from any form of distributed advice, signal, analysis, or content. Again, we fully DISCLOSE to the Subscriber base that the Service as a whole, the individual Parties, Representatives, or owners shall not be liable to any and all Subscribers for any losses or damages as a result of any action taken by the Subscriber from any trade idea or signal posted on the website(s) distributed through any form of social-media, email, the website, and/or any other electronic, written, verbal, or future form of communication . All analysis, trading signals, trading recommendations, all charts, communicated interpretations of the wave counts, and all content from any media form produced by www.Elliottwave-forecast.com and/or the Representatives are solely the opinions and best efforts of the respective author(s). In general Forex instruments are highly leveraged, and traders can lose some or all of their initial margin funds. All content provided by www.Elliottwave-forecast.com is expressed in good faith and is intended to help Subscribers succeed in the marketplace, but it is never guaranteed. There is no “holy grail” to trading or forecasting the market and we are wrong sometimes like everyone else. Please understand and accept the risk involved when making any trading and/or investment decision. UNDERSTAND that all the content we provide is protected through copyright of EME PROCESSING AND CONSULTING, LLC. It is illegal to disseminate in any form of communication any part or all of our proprietary information without specific authorization. UNDERSTAND that you also agree to not allow persons that are not PAID SUBSCRIBERS to view any of the content not released publicly. IF YOU ARE FOUND TO BE IN VIOLATION OF THESE RESTRICTIONS you or your firm (as the Subscriber) will be charged fully with no discount for one year subscription to our Premium Plus Plan at $1,799.88 for EACH person or firm who received any of our content illegally through the respected intermediary’s (Subscriber in violation of terms) channel(s) of communication.
Recommended content
Editors’ Picks

AUD/USD turns south toward 0.6500 as US Dollar finds fresh demand
AUD/USD hs turned south toward 0.6500 in Asian trading on Wednesday. The pair lacks bullish conviction after the PBOC left the Lona Prime Rates unchanged. Escalating Russia-Ukraine geopolitical tensions and renewed US Dollar demand keep the Aussie on the edge ahead of Fedspeak.

USD/JPY jumps back above 155.00 as risk sentiment improves
USD/JPY has regained traction, rising back above 155.00 in Wednesday's Asian session. A renewed US Dollar uptick alongside the US Treasury bond yields and an improving risk tone counter Japanese intervention threats and Russia-Ukraine tensions, allowing the pair to rebound.

Gold advances to over one-week high on rising geopolitical risks
Gold price (XAU/USD) attracts some follow-through buying for the third consecutive day on Wednesday and climbs to a one-and-half-week high, around the $2,641-2,642 region during the Asian session.

UK CPI set to rise above BoE target in October, core inflation to remain high
The United Kingdom’s (UK) Consumer Price Index (CPI) data for October will be published by the Office for National Statistics (ONS) on Wednesday at 07:00 GMT.

How could Trump’s Treasury Secretary selection influence Bitcoin?
Bitcoin remained upbeat above $91,000 on Tuesday, with Trump’s cabinet appointments in focus and after MicroStrategy purchases being more tokens.

Best Forex Brokers with Low Spreads
VERIFIED Low spreads are crucial for reducing trading costs. Explore top Forex brokers offering competitive spreads and high leverage. Compare options for EUR/USD, GBP/USD, USD/JPY, and Gold.