![]() Elliott Wave Forecast Team
Elliott Wave Forecast Team
ElliottWave-Forecast.com
Caterpillar Inc. (often shortened to CAT) is an American Fortune 100 corporation that designs, develops, engineers, manufactures, markets, and sells machinery, engines, financial products, and insurance to customers via a worldwide dealer network. It is the world’s largest construction- equipment manufacturer. Caterpillar stock is a component of the Dow Jones Industrial Average.
Caterpillar November 28th daily chart
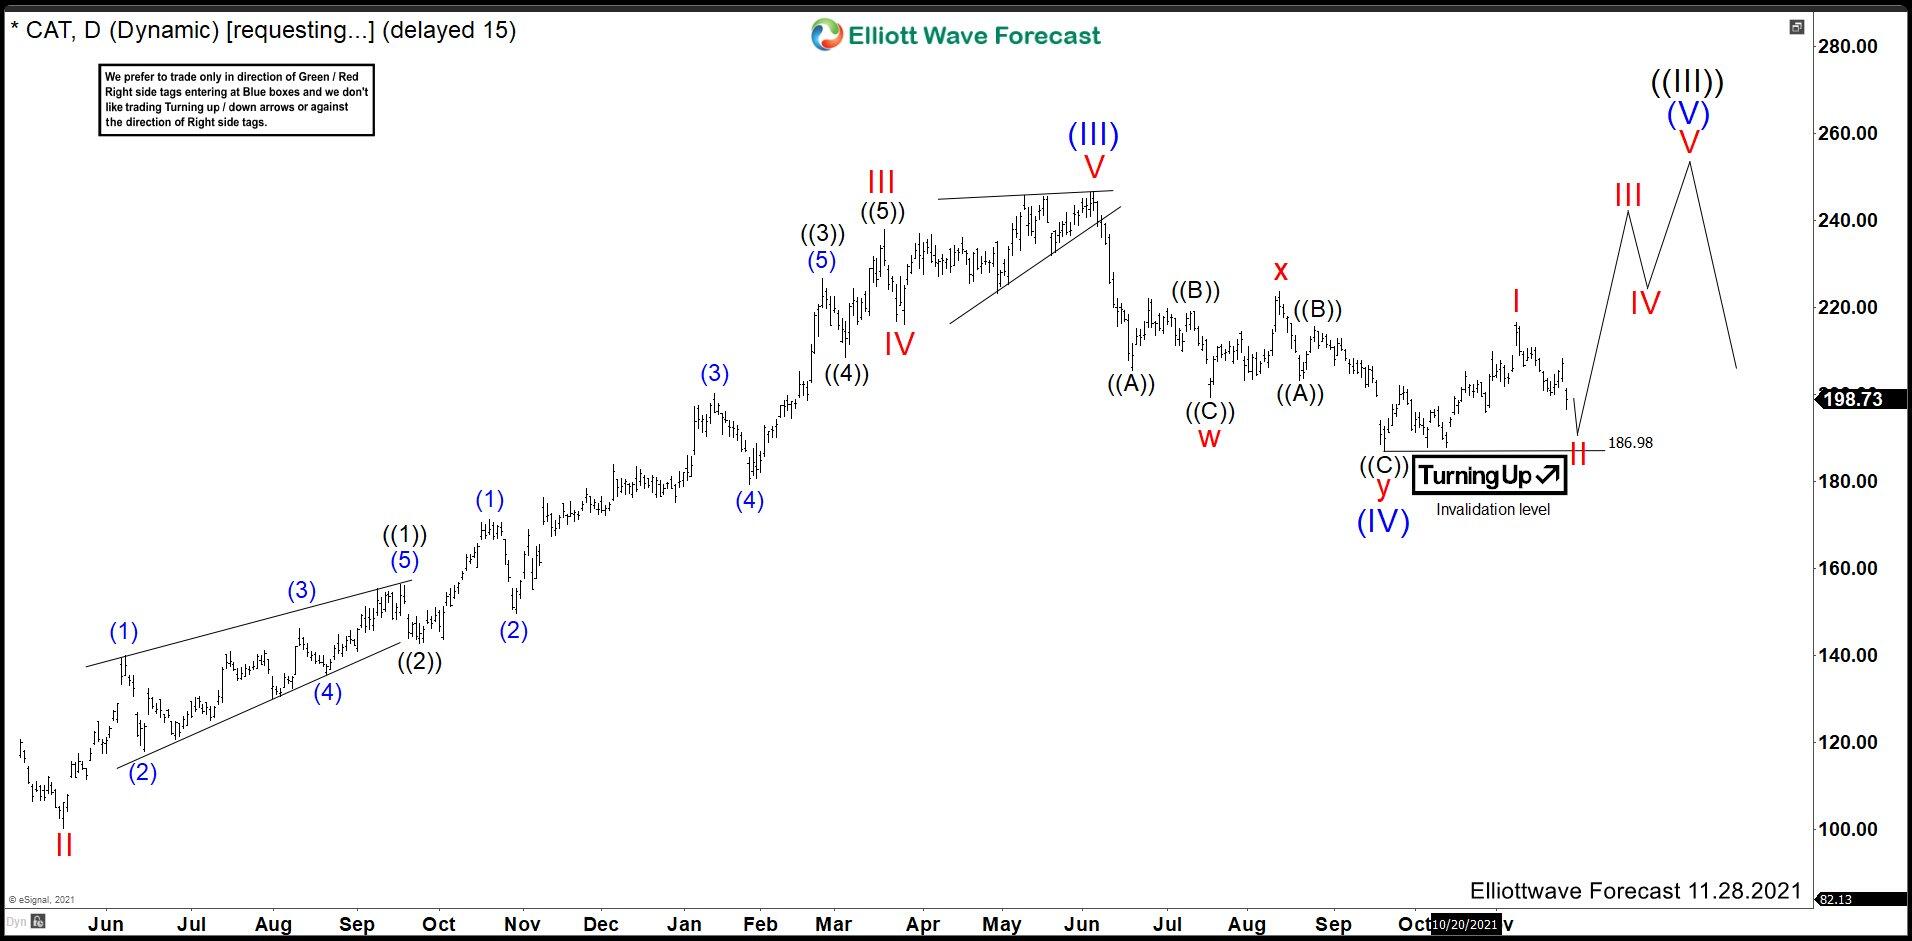
At the beginning, we labeled an impulse structure from Jan 2016 low that ended at 173.24 in Jan 2018 as wave (I). Then Caterpillar made a pullback and built a zig-zag structure ending wave (II) at 87.50 in March 2020 when the COVID pandemic spread worldwide.
A bounce appeared in that year and we started to develop wave (III). We could see in the chart above wave (III) structure that ended at 246.69 in May 2021. Thus, another pullback began making a double correction structure and we called wave (IV) ended at 186.98. From here, we were looking for a last impulse to break wave (III) peak and complete the impulse structure from 2016 as wave (V).
Caterpillar December 26th daily chart
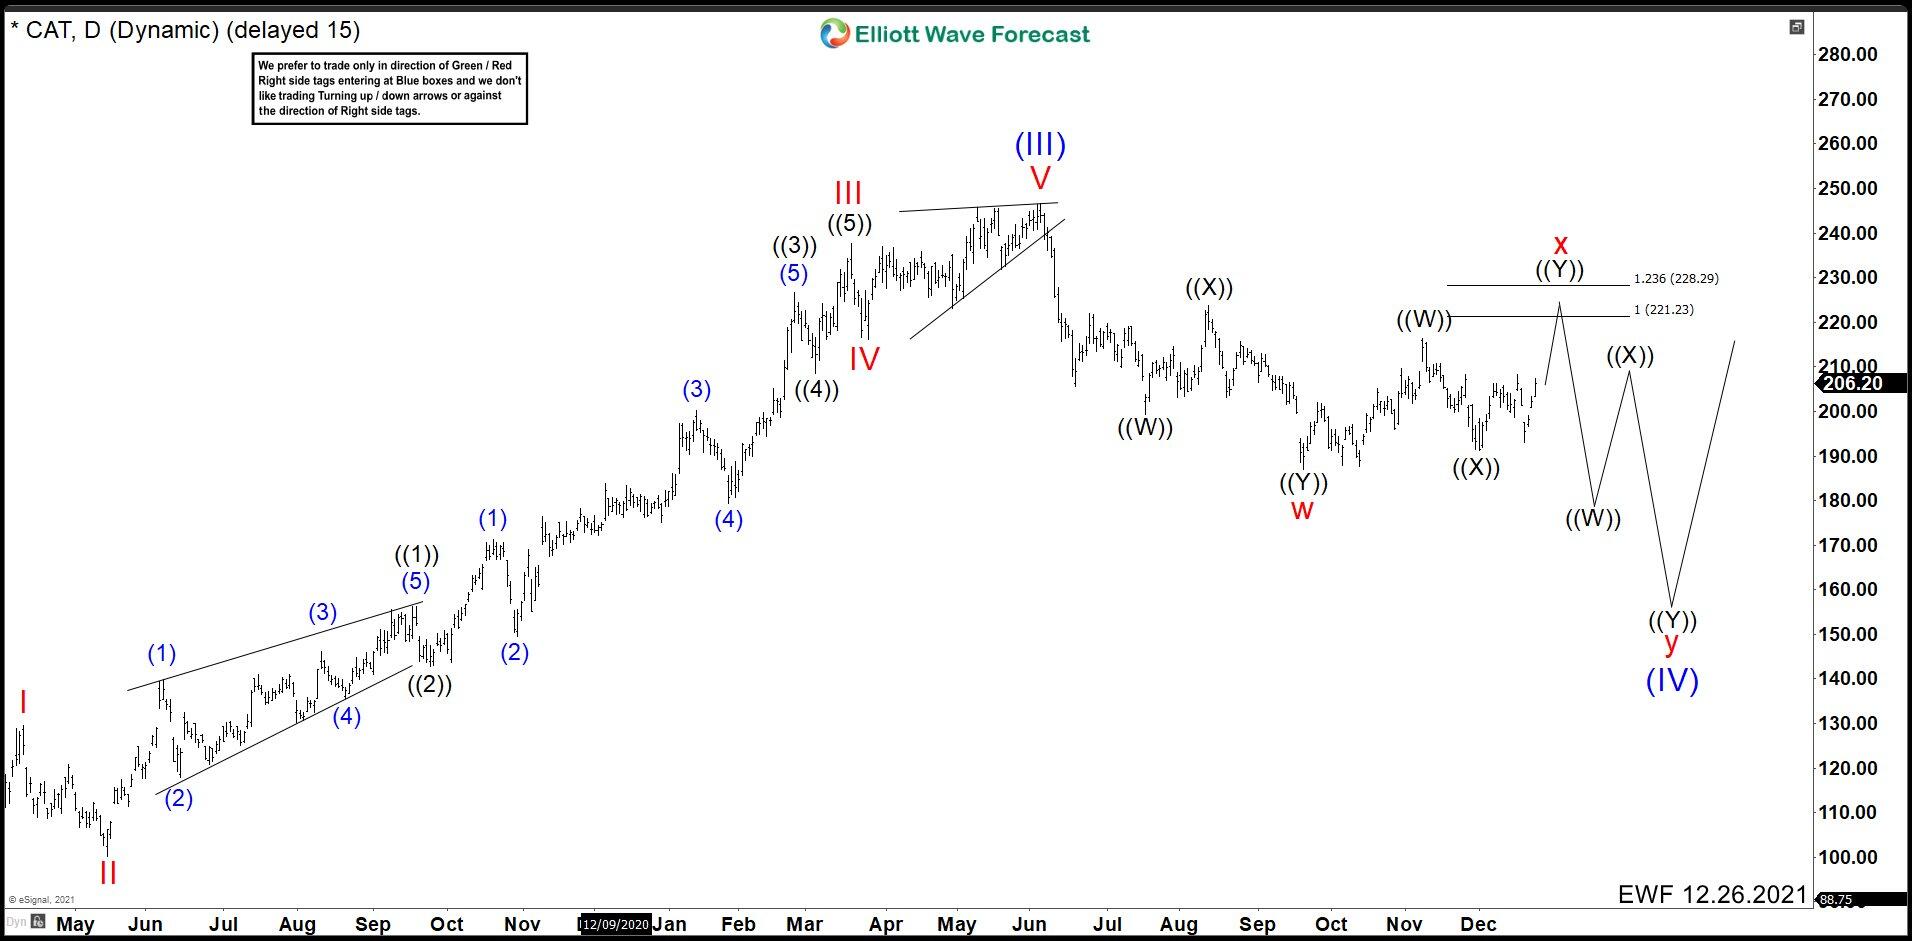
After Christmas, we analyzed the world capital market and realized that it was close to make a major correction and it was better to forget about looking for wave (V) and rather, it was better to look for a continuation of wave (IV) with a more complex double correction. For this reason, we deleted the impulse forecast in Caterpillar and changed it to a double correction to complete wave X formed by waves ((W)), ((X)), and ((Y)). Using the Fibonacci tool, we suggested the 221.00 – 228.00 zone as a possible area where wave X should end and continue declining.
Caterpillar January 7th 2022 daily chart
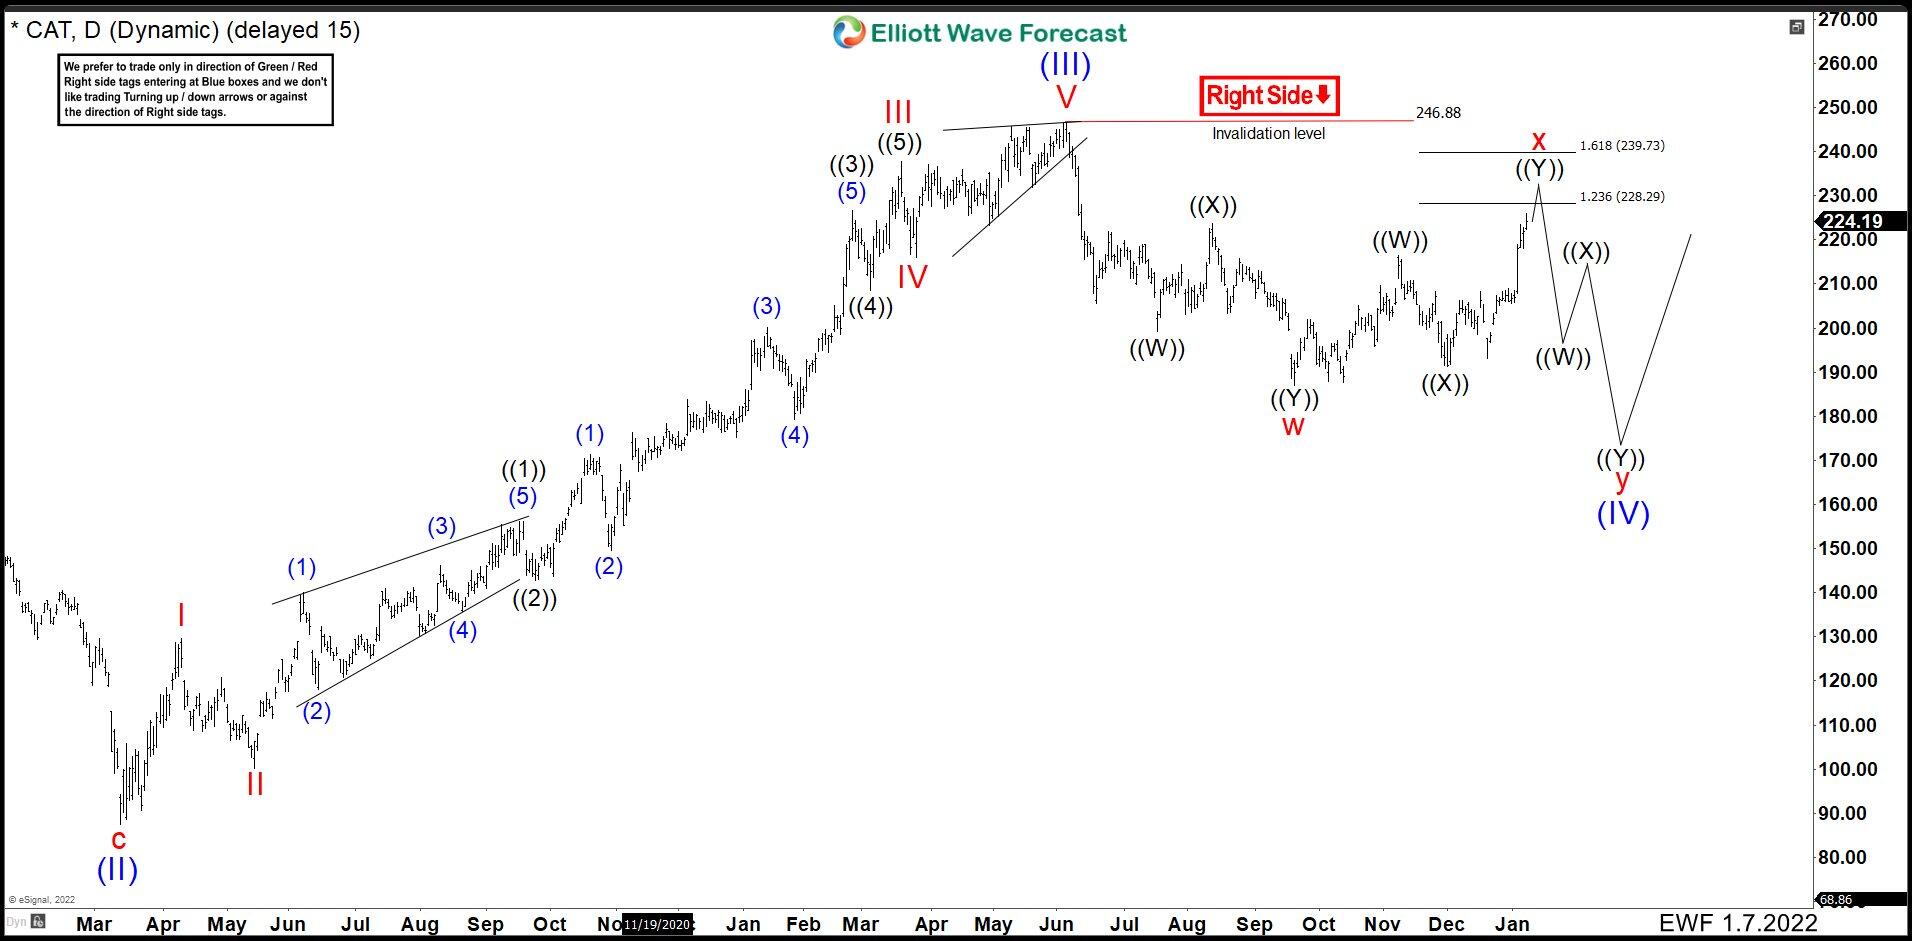
The wave ((W)) ended at 216.47 then pullback wave ((X)) ended at 191.36. Wave ((Y)) started slow, but it moved strong high at the beginning of 2022.The internal structure in lesser degree was a flat correction (A), (B), (C), where wave (C) was an impulse. With this impulse, we change the target in Caterpillar to complete wave X change it from 221.00 – 228.00 to 228.00 – 239.00 area. (If you want to learn more about Elliott Wave Theory, please follow these links: Elliott Wave Education and Elliott Wave Theory).
Caterpillar January 28th 2022 daily chart
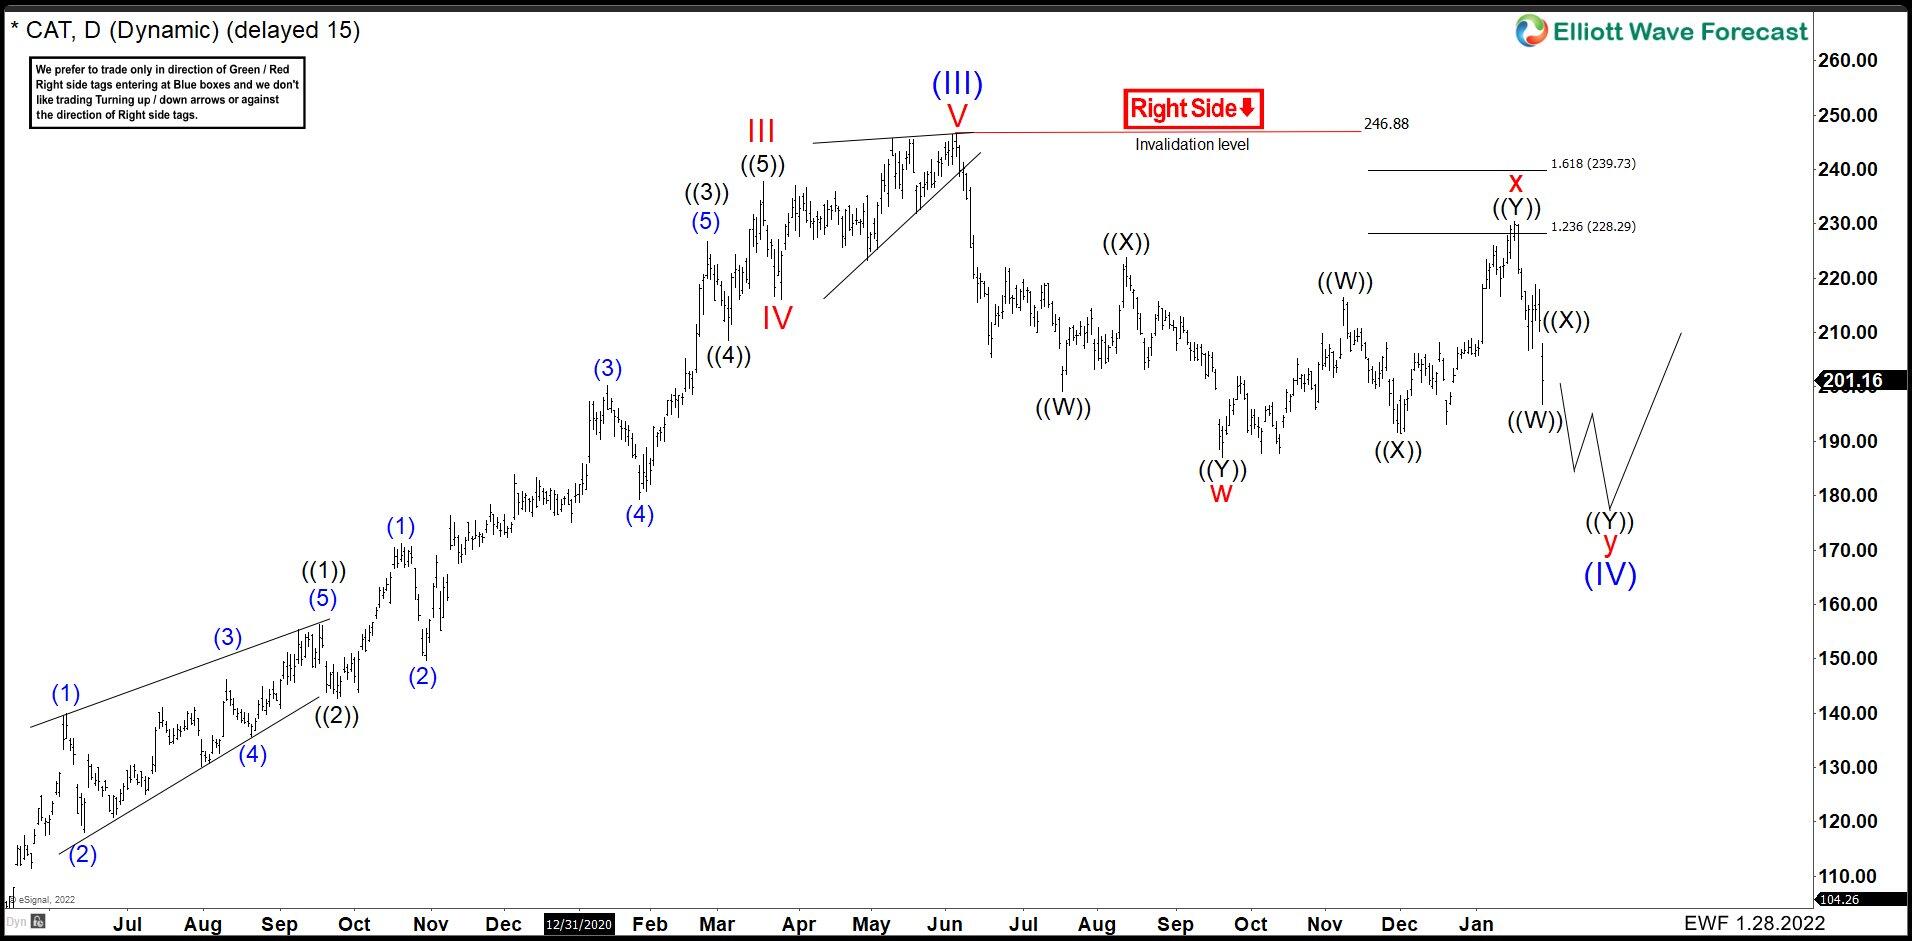
Caterpillar continued higher ending wave ((Y)) and X at 230.96. Then we saw a reaction lower as expected and we should continue lower to break 186.98 and complete wave (IV). The possible area to complete wave (IV) comes in 170.00 – 184.00 and from there we should continue with the rally to complete wave (V).
FURTHER DISCLOSURES AND DISCLAIMER CONCERNING RISK, RESPONSIBILITY AND LIABILITY Trading in the Foreign Exchange market is a challenging opportunity where above average returns are available for educated and experienced investors who are willing to take above average risk. However, before deciding to participate in Foreign Exchange (FX) trading, you should carefully consider your investment objectives, level of xperience and risk appetite. Do not invest or trade capital you cannot afford to lose. EME PROCESSING AND CONSULTING, LLC, THEIR REPRESENTATIVES, AND ANYONE WORKING FOR OR WITHIN WWW.ELLIOTTWAVE- FORECAST.COM is not responsible for any loss from any form of distributed advice, signal, analysis, or content. Again, we fully DISCLOSE to the Subscriber base that the Service as a whole, the individual Parties, Representatives, or owners shall not be liable to any and all Subscribers for any losses or damages as a result of any action taken by the Subscriber from any trade idea or signal posted on the website(s) distributed through any form of social-media, email, the website, and/or any other electronic, written, verbal, or future form of communication . All analysis, trading signals, trading recommendations, all charts, communicated interpretations of the wave counts, and all content from any media form produced by www.Elliottwave-forecast.com and/or the Representatives are solely the opinions and best efforts of the respective author(s). In general Forex instruments are highly leveraged, and traders can lose some or all of their initial margin funds. All content provided by www.Elliottwave-forecast.com is expressed in good faith and is intended to help Subscribers succeed in the marketplace, but it is never guaranteed. There is no “holy grail” to trading or forecasting the market and we are wrong sometimes like everyone else. Please understand and accept the risk involved when making any trading and/or investment decision. UNDERSTAND that all the content we provide is protected through copyright of EME PROCESSING AND CONSULTING, LLC. It is illegal to disseminate in any form of communication any part or all of our proprietary information without specific authorization. UNDERSTAND that you also agree to not allow persons that are not PAID SUBSCRIBERS to view any of the content not released publicly. IF YOU ARE FOUND TO BE IN VIOLATION OF THESE RESTRICTIONS you or your firm (as the Subscriber) will be charged fully with no discount for one year subscription to our Premium Plus Plan at $1,799.88 for EACH person or firm who received any of our content illegally through the respected intermediary’s (Subscriber in violation of terms) channel(s) of communication.
Recommended content
Editors’ Picks

EUR/USD holds steady above 1.0800, looks to post weekly losses
EUR/USD trades marginally higher on the day above 1.0800 after the data from the US showed that Durable Goods Orders declined by 0.8% in September. Nevertheless, the pair remains on track to close the fourth consecutive week in negative territory.

GBP/USD extends recovery to 1.3000 area
GBP/USD extends its recovery and trades at around 1.3000 in the American session on Friday. The US Dollar struggles to gather strength as the market mood remains positive heading into the weekend, allowing the pair to hold its ground.

Gold fluctuates in narrow range below $2,750
Gold stays in a consolidation phase and fluctuates in a relatively tight range below $2,750 on Friday. US Treasury bond yields stabilize in the American session, making it difficult for XAU/USD to gather directional momentum.
Crypto Today: XRP, Bitcoin and Ethereum decline as Ripple files response to SEC appeal
XRP loses over 1.30% as Ripple's executive confirms the filing of an important document in the appeals process in the SEC lawsuit. Bitcoin corrects less than 1% and sustains above $67,500. Ethereum is down nearly 0.20%, holding above the key support level of $2,500.

US elections: The race to the White House tightens
Trump closes in on Harris’s lead in the polls. Neck and neck race spurs market jitters. Outcome still hinges on battleground states.

Best Forex Brokers with Low Spreads
VERIFIED Low spreads are crucial for reducing trading costs. Explore top Forex brokers offering competitive spreads and high leverage. Compare options for EUR/USD, GBP/USD, USD/JPY, and Gold.