How the hidden signs of selling into strength could shake the S&P 500 [Video]
![How the hidden signs of selling into strength could shake the S&P 500 [Video]](https://editorial.fxstreet.com/images/Markets/Equities/SP500/wall_street_nyse2-637299021353183737_XtraLarge.jpg)
Watch the free-preview video below extracted from the WLGC session before the market opens on 17 Jul 2024 to find out the following:
-
The simplest way to spot a market rotation.
-
The analogues to adopt to anticipate the market correction.
-
Why the change of character bar on last Thursday signals a shift in the market?
-
And a lot more.
Market environment
The bullish vs. bearish setup is 661 to 25 from the screenshot of my stock screener below.
There is a clear rotation from Nasdaq 100 and the S&P 500 into the Russell 2000 (& the Dow Jones) since 11 Jul 2024 (Thursday).
This is further confirmed by the significant improvement in both the number of the bullish setups and market breadth.
A pullback or consolidation could provide a great opportunity for re-accumulation. Now again is the best time to identify the next batch of leaders (like KRE)
Three stocks ready to soar
5 “low-hanging fruits” trade entries setups KD, TME + 19 actionable setups JPM were discussed during the live session before the market open (BMO).
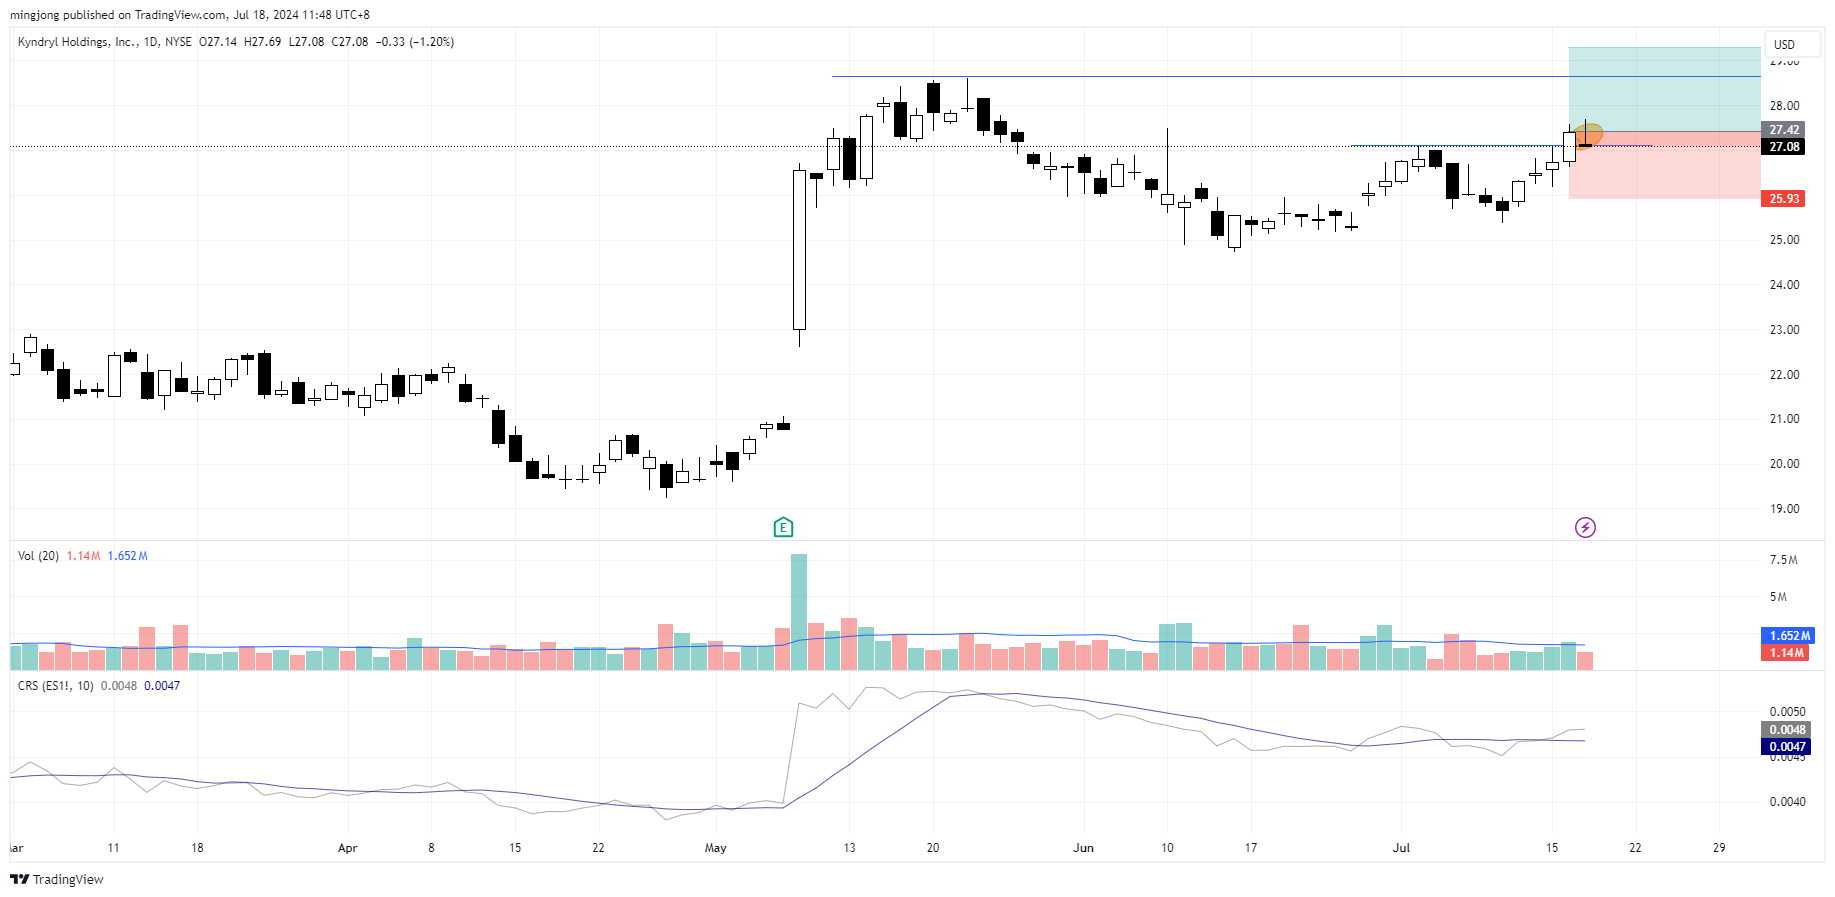
KD
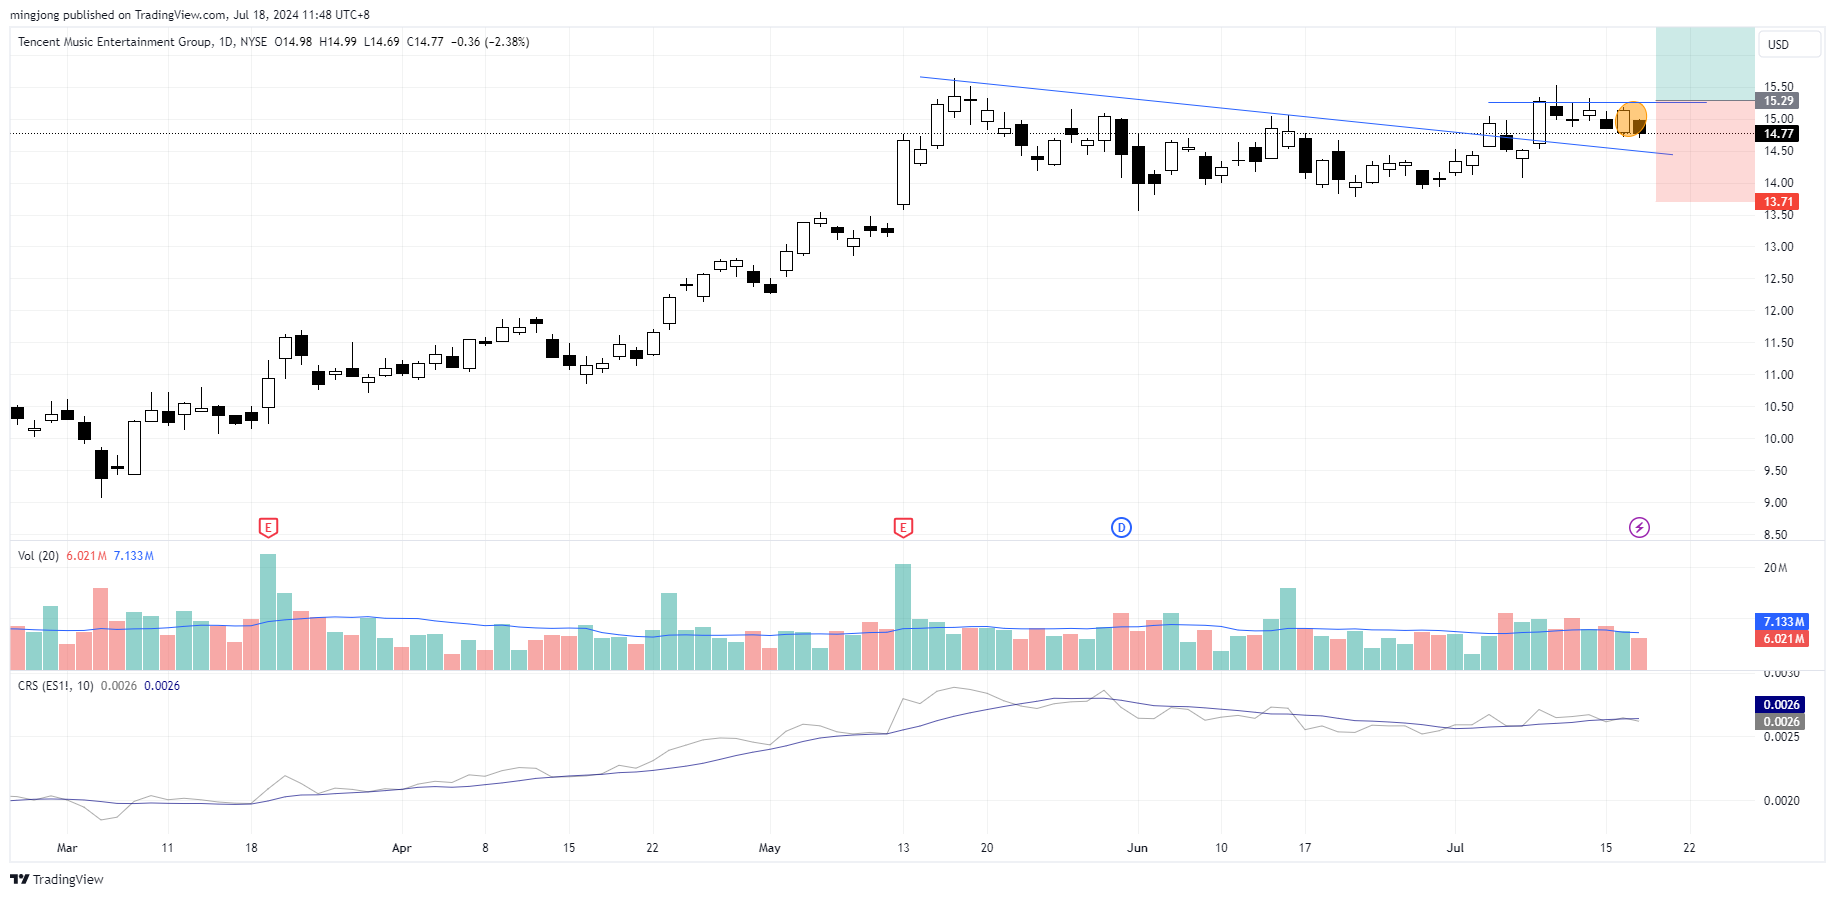
TME
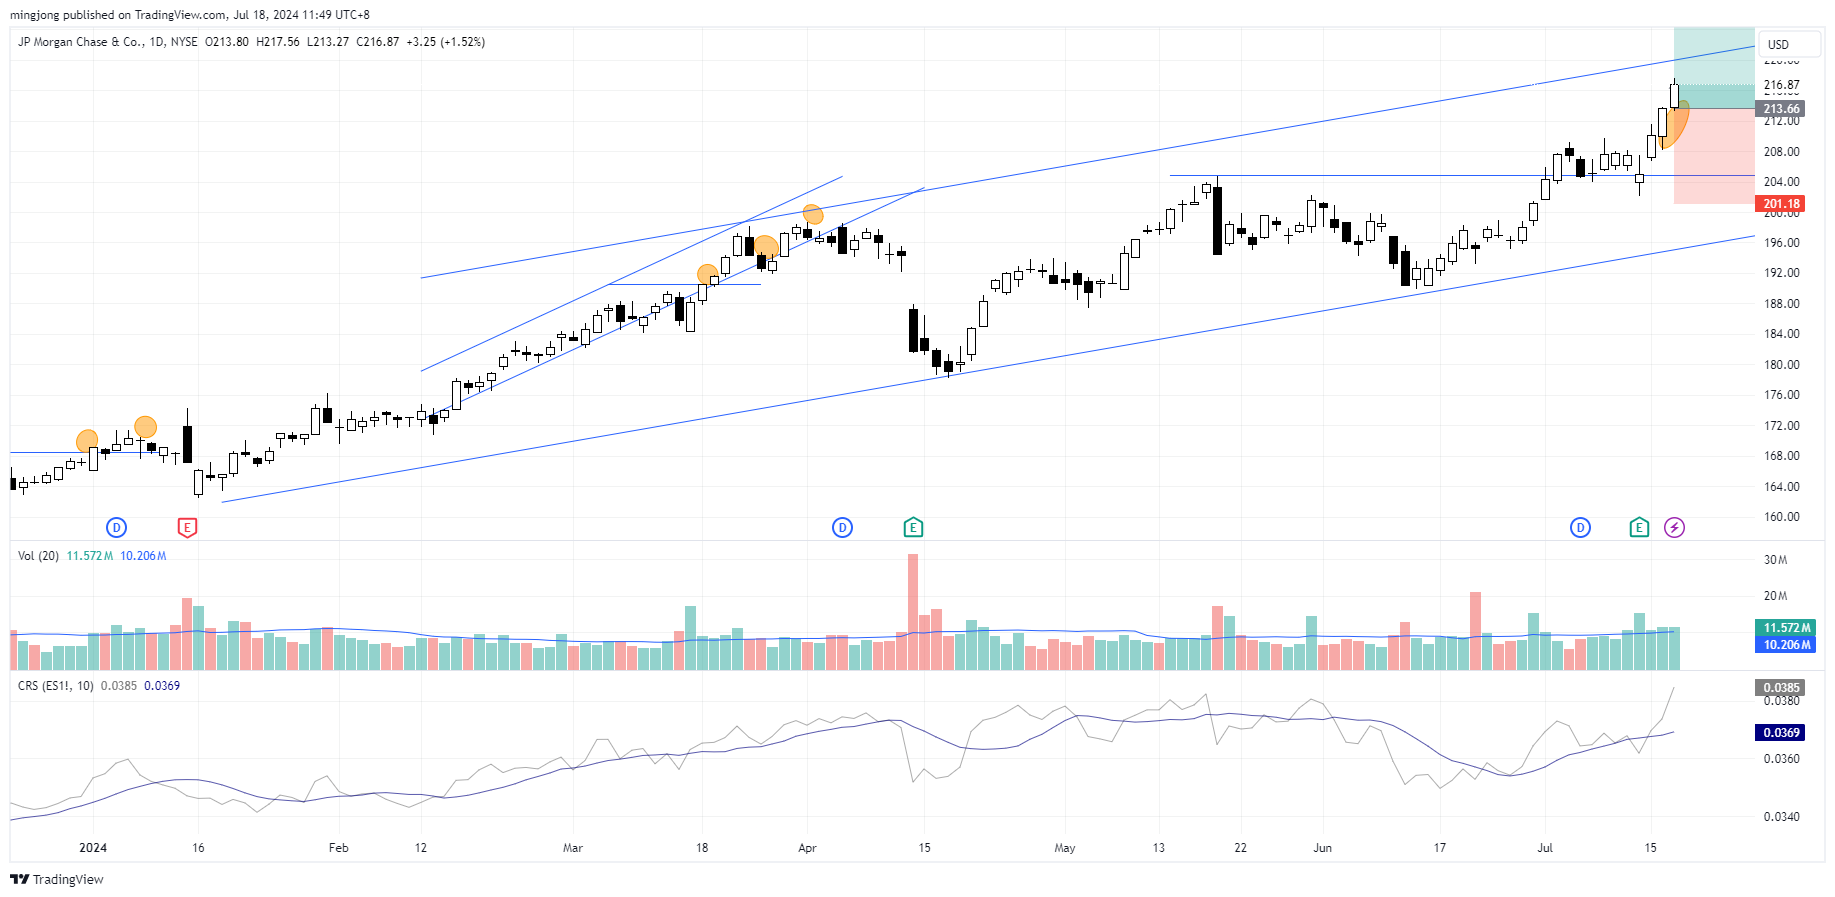
JPM
Author

Ming Jong Tey
Independent Analyst
Ming Jong Tey has been trading since 2008. He started his learning journey from technical analysis (indicators, Fibonacci, etc...) to value investing. Throughout his journey, he develops an interest in price action with chart pattern trading.


