Home Depot (HD) Elliott Wave forecast: Key levels for buyers

The Home Depot, Inc. leads the home improvement market, selling tools, appliances, and services. Founded in 1978, it runs over 2,300 stores in North America, prioritizing customer service, innovation, and sustainability. The stock went public in the early ‘80s and remains highly profitable. The price is rallying within an all-time bullish cycle from 1981. Buyers have taken several opportunities from the dip. Meanwhile, despite coming from a record high in November 2024, buyers should continue to dominate. Thus, we do not recommend selling this stock.
From the all-time low, $HD completed the first impulse wave – the grand-supercycle degree wave ((I)) in September 1983. It closed wave ((I)) at around 70 cents. Afterwards, a pullback followed for wave ((II)) to 23 cents. Wave ((II)) was completed in November 1985. Expectedly, wave ((III)) followed with a massive rally to close around $70 in March 2000. The wave ((IV)) pullback finished around $17 in October 2008. From October 2008, wave ((V)) emerged. Meanwhile, waves I, II, III, IV have all completed while V of ((V)) emerged from June 2022. Thus, the long-term impulse cycle from the all-time low may soon be over. However, wave V of ((V)) appears not have finished. Thus, buyers can still buy from the pullbacks.
Meanwhile, as we have often noticed, pullbacks appear as 3, 7 or 11 swings structures. In other words, pullbacks could be single, double or triple corrections. For this case, we will look at the possibilities of a single and a double correction. In addition, we will discuss how traders can take advantage of the current pullback.
Home Depot Elliott Wave analysis – Single correction pullback scenario
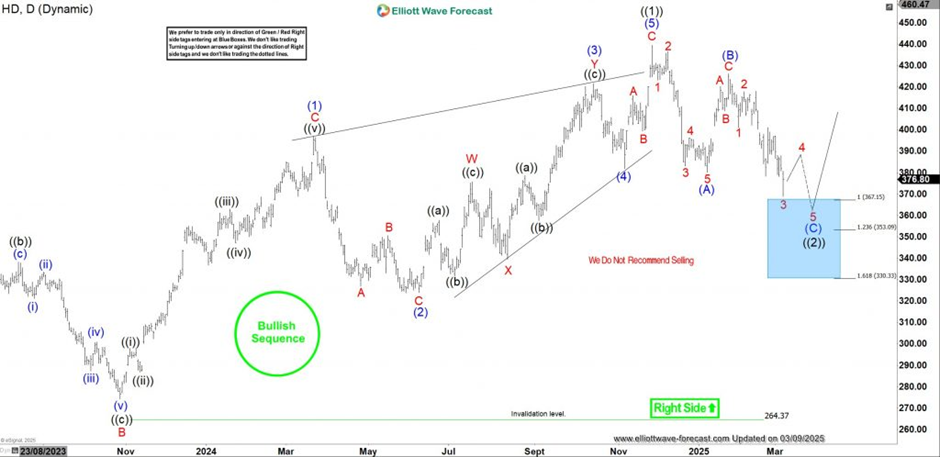
Home Depot Chart, Daily
The daily chart above shows the impulse rally to the November 2024 high may have just completed wave ((1)) of V. Thus, the current pullback from that top should be ((2)). Meanwhile, the pullback for wave ((2)) is about to finish a 3-swing structure – a zigzag structure. The pullback should end at 367.15-330.33 depicted by the blue box. From the blue box, traders can go long and set exit price at 330. However, compared to the height of wave ((1)), wave ((2)) appears very shallow. In this case, we can expect a deeper double correction. However, we will determine that by the reaction from the blue box. If the bounce from the blue box is an impulse structure above 426, we can confirm wave ((2)) has finished and ((3)) advancing. Thus buyers from the blue box will be in a massive profit.
Home Depot Elliott Wave analysis – Double correction pullback scenario
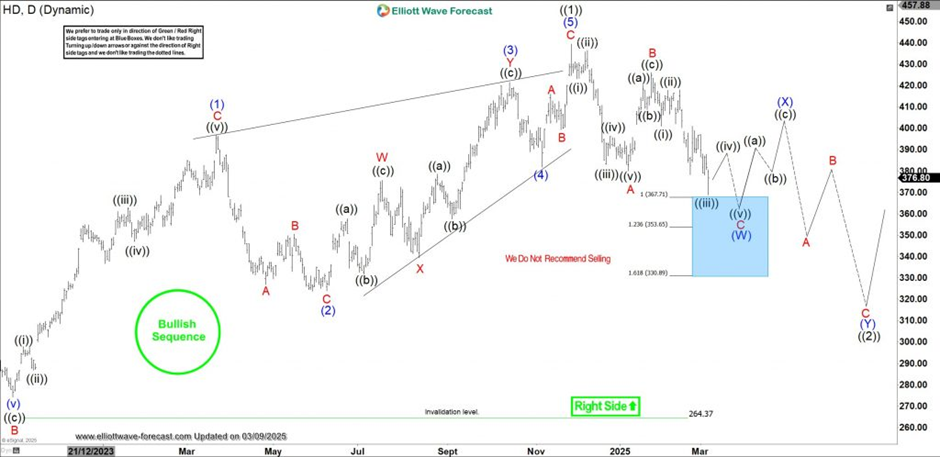
Home Depot Chart, Daily
On the other hand, the reaction from the blue box could be corrective and then price could turn lower as the chart above shows. Thus, buyers from this blue box will have closed some profits and adjusted rest to breakeven. This way, they can prepare for the a double correction if it eventually happens and then buy at the new blue box.
Author

Elliott Wave Forecast Team
ElliottWave-Forecast.com


