Hindustan Unilever Elliott Wave technical analysis [Video]
![Hindustan Unilever Elliott Wave technical analysis [Video]](https://editorial.fxstreet.com/images/TechnicalAnalysis/ChartPatterns/Chartism/foreign-exchange-market-chart-69068965_XtraLarge.jpg)
Hindustan Unilever Elliott Wave technical analysis
Function: Larger Degree Trend Higher (Intermediate degree, orange)
Mode: Motive
Structure: Impulse
Position: Minute Wave ((iii)) Navy
Details: Minute Wave ((iii)) Navy is progressing higher within Minor Wave 3 Grey of Intermediate Wave (5) Orange against 2425. A lower degree Minuette Wave (ii) Orange is unfolding now, before the rally resumes.
Invalidation point: 2425
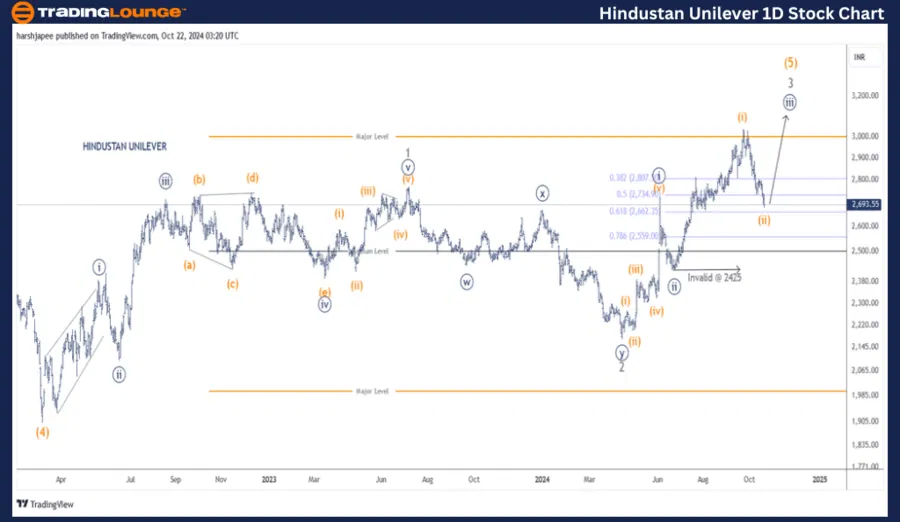
Hindustan Unilever daily chart technical analysis and potential Elliott Wave counts
Hindustan Unilever daily chart is indicating a progressive price action, which is unfolding Minor Wave 3 Grey against 2170 lows (Minor Wave 2 termination). The stock is trading around 2675 at the time of writing as support is expected to be seen through 2660 mark.
The stock had terminated Intermediate Wave (4) around 1890 levels in March 2022. Since then, it has managed to carve Minor Waves 1 and 2 around 2770 and 2170 levels respectively. It is now progressing within Minor Wave 3 Grey.
Furthermore, Minute ((i)) and ((ii)) within Minor Wave 3 look complete around 2733 and 2425 levels respectively. Minute Wave ((iii)) is extending and should be sub divided into five waves going forward.
Hindustan Unilever Elliott Wave technical analysis
Function: Larger Degree Trend Higher (Intermediate degree, orange).
Mode: Motive.
Structure: Impulse.
Position: Minute Wave ((iii)) Navy.
Details: Minute Wave ((iii)) Navy is progressing higher within Minor Wave 3 Grey of Intermediate Wave (5) Orange against 2425. A lower degree Minuette Wave (ii) Orange is unfolding now, before the rally resumes as Minute Wave ((iii)) could be extending.
Invalidation point: 2425.
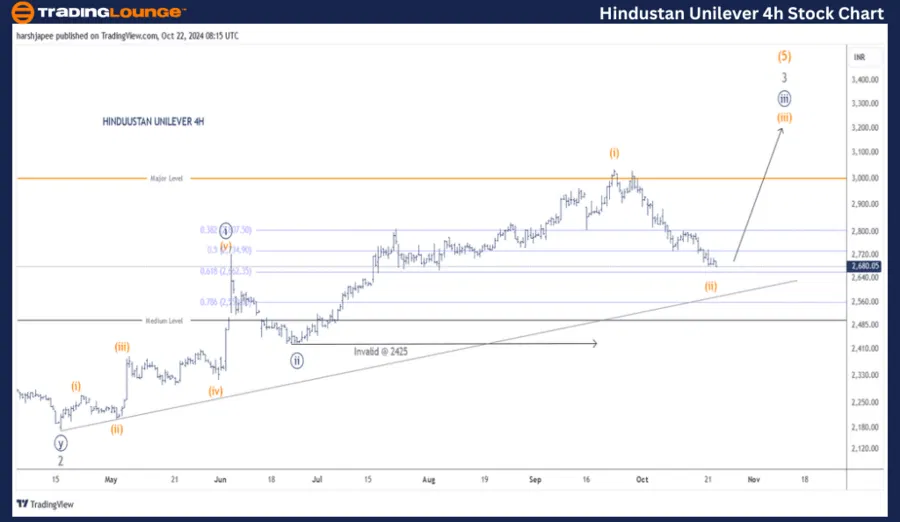
Hindustan Unilever four-hour chart technical analysis and potential Elliott Wave counts
Hindustan Unilever 4H chart is highlighting the sub waves post Minor Wave 2 Grey termination around 2170 mark. Kindly note that Minute Wave ((i)) and ((ii)) are looking complete around 2730 and 2425 levels respectively. If correct, Minute Wave ((iii)) should be underway soon with 2425 intact.
Conclusion
Hindustan Unilever is progressing higher within Minuette Wave (iii) Orange of Minute Wave ((iii)) Navy within Minor Wave 3 Grey of Intermediate Wave (5) Orange against 2425.
Hindustan Unilever Elliott Wave technical analysis [Video]
Author

Peter Mathers
TradingLounge
Peter Mathers started actively trading in 1982. He began his career at Hoei and Shoin, a Japanese futures trading company.


