HDFC bank is looking good to continue the rally from the blue box
HDFC Bank Limited is an Indian banking and financial services company headquartered in Mumbai. It is India’s largest private sector bank by assets and world’s 10th largest bank by market capitalization as of April 2021, the third largest company by market capitalization of $122.50 billion on the Indian stock exchanges. It is also the fifteenth largest employer in India with nearly 120,000 employees.
HDFC Bank daily chart August 09th 2022
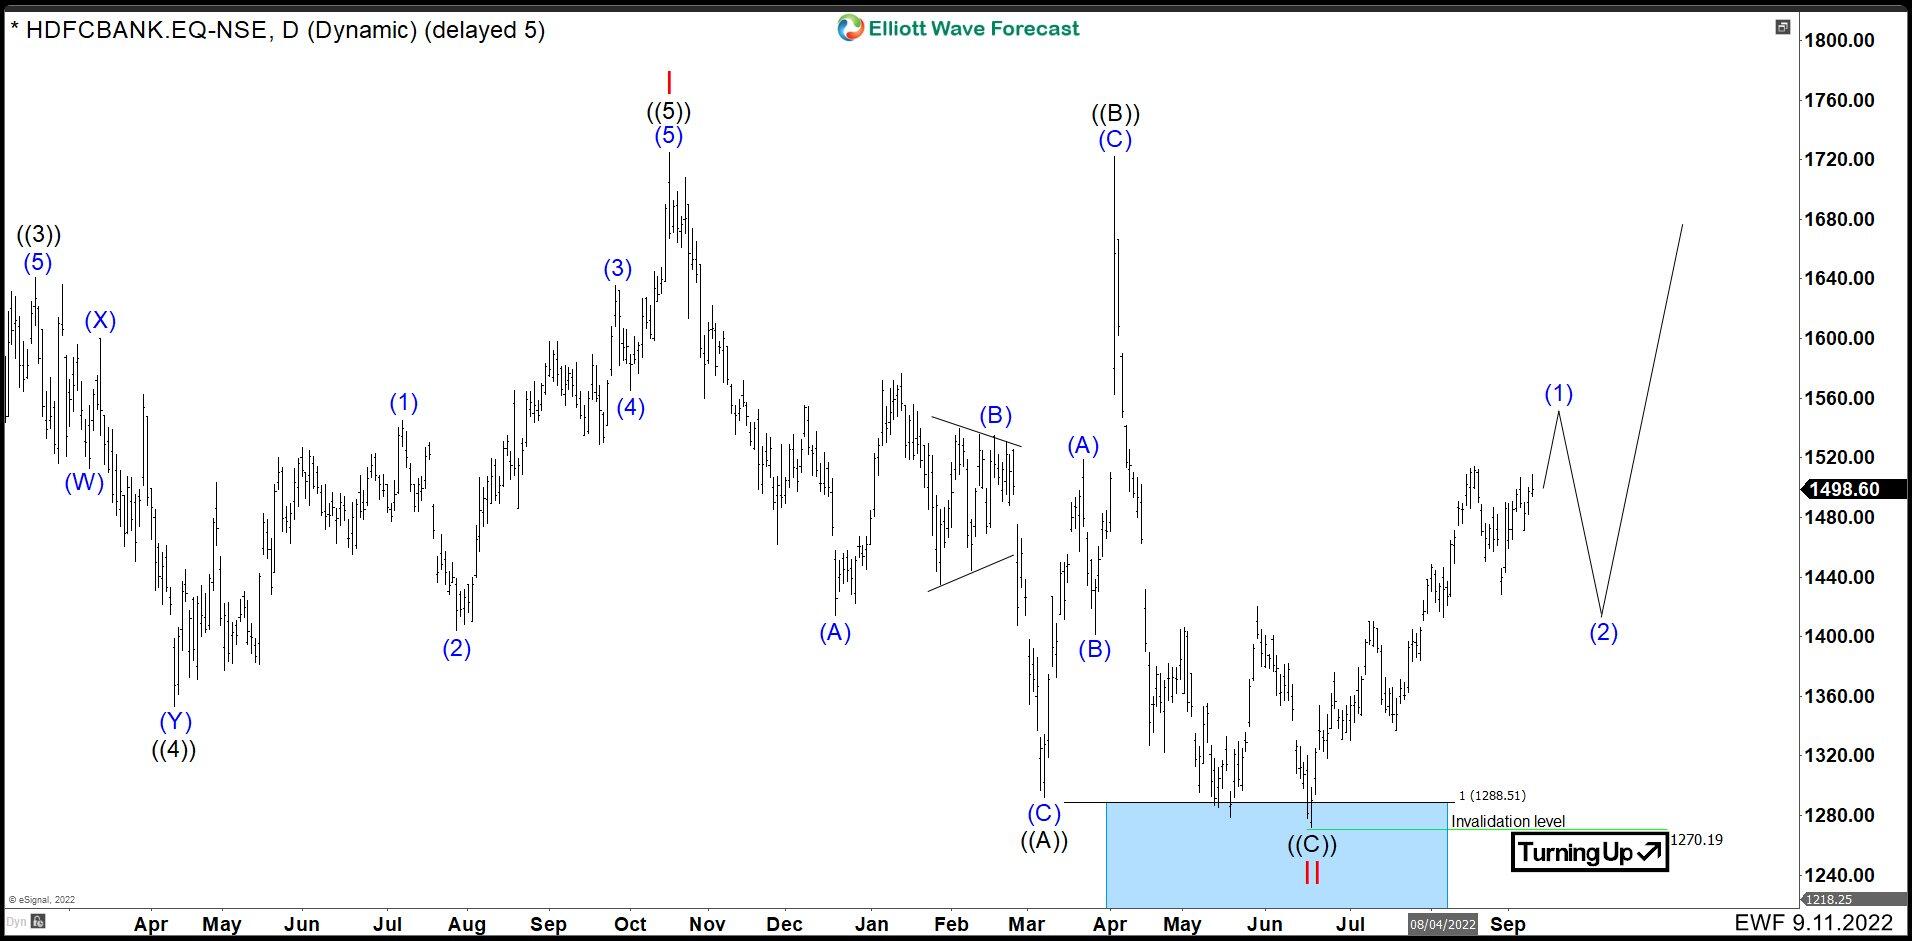
HDFC BANK completed an impulse at 1726.02 from March 2020 low and we called it wave I. From there we had a corrective movement. The drop from the peak 1726.02 was in 3 waves. Wave ((A)) ended at 1291.96 making 3 swings lower. The market had a strong rebound that tested the highs ending wave ((B)) at 1721.65 and turned lower quickly. Therefore, wave ((C)) and wave II ended the cycle at 1270.19 to continue the rally from the blue box. (If you want to learn more about Elliott Wave Theory, follow these links: Elliott Wave Education and Elliott Wave Theory).
HDFC Bank daily chart December 28th 2022
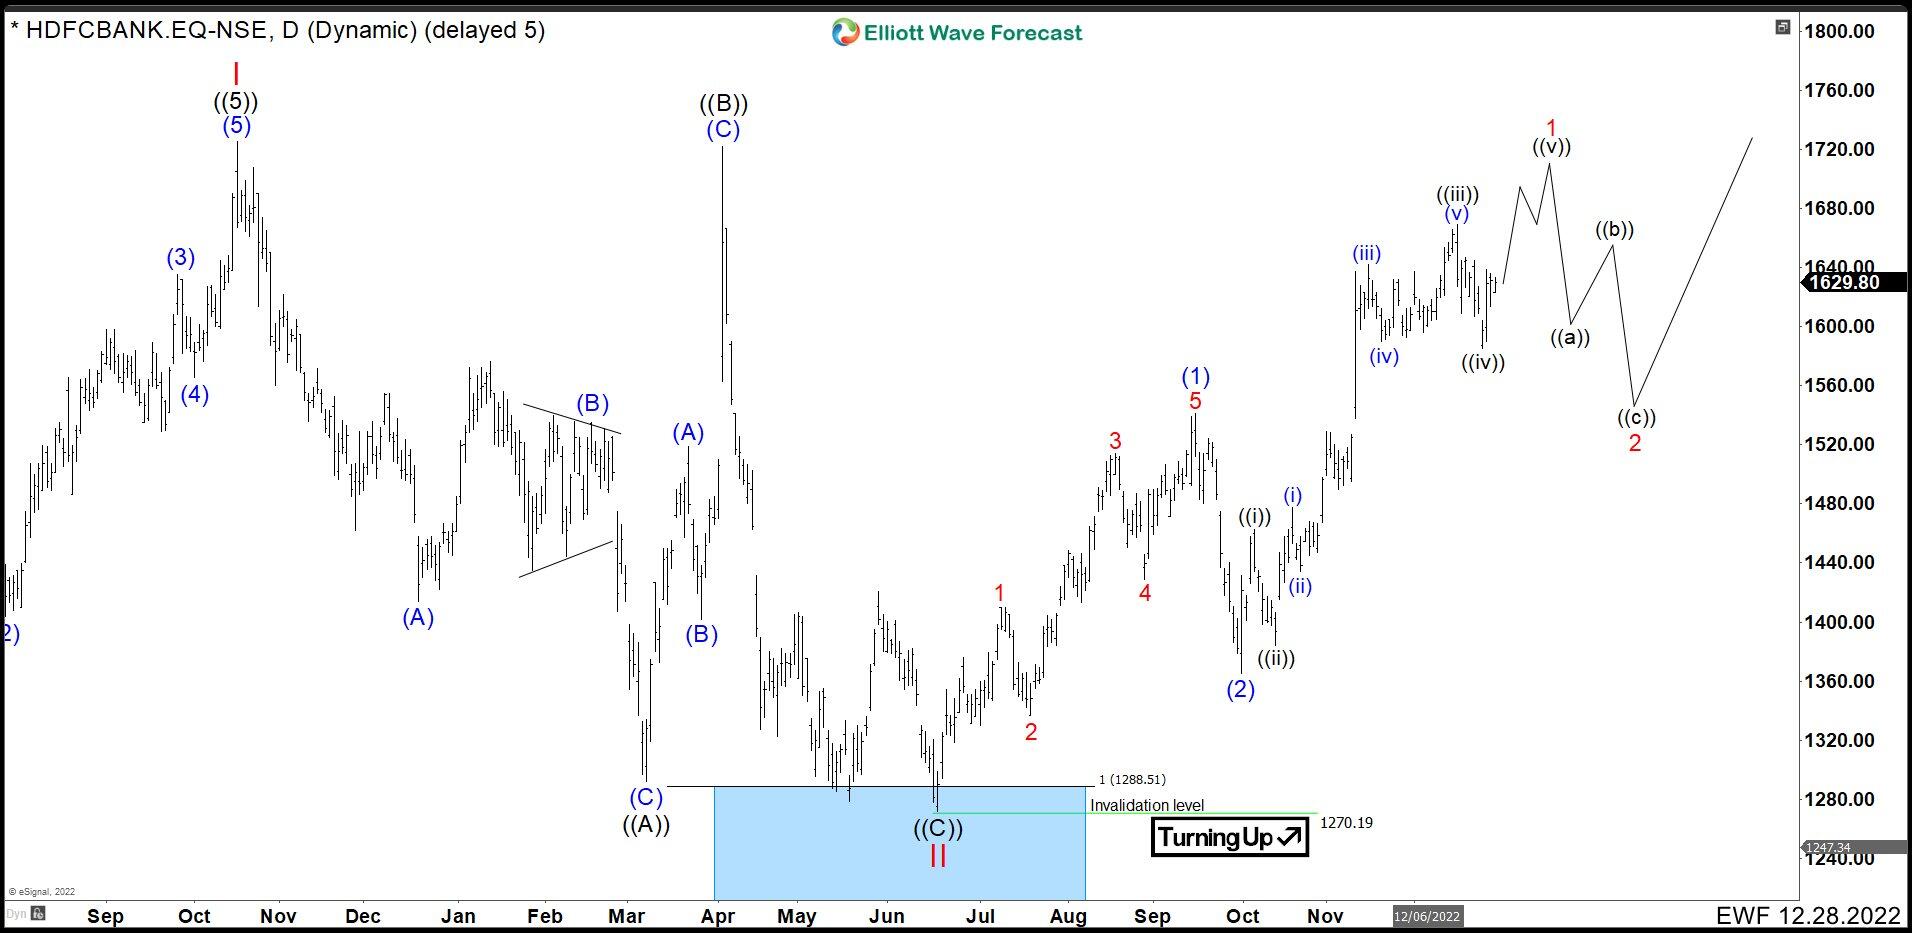
The chart above, it is showing a clear impulse from the blue box that we called wave ((1)) ended at 1540.77. Wave (2) correction was sharply ended at 1364.09 and bounce again. Currently, we are looking to end another impulse in lesser degree as wave 1. Up from 1364.09, wave ((i)) ended at 1462.97 and wave ((ii)) pullback finished at 1382.99. Then HDFC continued completing 5 waves up and wave ((iii)) at 1669.46 and pullback wave ((iv)) as zig zag structure ended at 1584.39. We are expecting one more higher to reach 1689 – 1722 area to complete wave ((v)) of 1 before see 3 or 7 swings correction as wave 2 and rally again. To confirm this last high HDFC needs to break 1669.46, if market breaks first 1584.39 low, then wave 1 is done and wave 2 has already started. The count is valid as market stays above 1364.09.
Author

Elliott Wave Forecast Team
ElliottWave-Forecast.com


