HDFC Bank (one day chart) Elliott Wave technical analysis

Function: Larger Degree Trend Higher (Intermediate degree, orange).

Mode: Motive.

Structure: Impulse.

Position: Minute Wave ((iv)) Navy Flat.

Details: Minute Wave ((v)) Navy, is now progressing higher within Minor Wave 3 Grey of Intermediate Wave (5) Orange against 1426. No change.

Invalidation point: 1426.

Chart

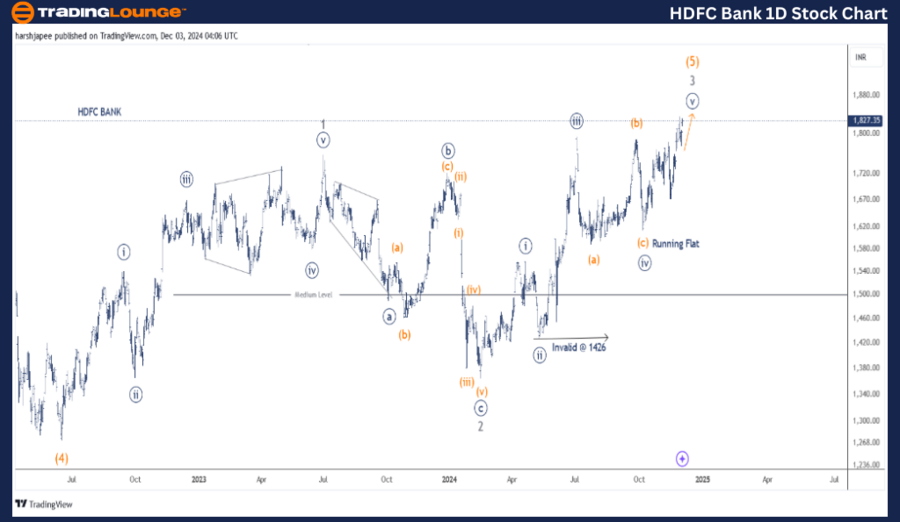
HDFC BANK daily chart technical analysis and potential Elliott Wave counts:

HDFC BANK daily chart is indicating a progressive rally, which is within Minor Wave 3 Grey of Intermediate Wave (5) Orange against 1426 mark. The stock has closed above 1800 mark and could accelerate as immediate resistance around 1795 has been taken out.

The stock had dropped to 1275 lows in June 2022, terminating Intermediate Wave (4). The wave structure has been quite overlapping and the best possible counts could be Minor Wave 1 and 2 complete around 1750 and 1365 levels respectively.

Since then, Minor Wave 3 has been unfolding and is potentially extending. An alternative count could be Minute Wave ((i)) of Minor 3 is unfolding against 1426 mark.

HDFC Bank (four-hour chart) Elliott Wave technical analysis

Function: Larger Degree Trend Higher (Intermediate degree, orange).

Mode: Motive.

Structure: Impulse.

Position: Minute Wave ((iv)) Navy Flat.

Details: Minute Wave ((v)) Navy, is now progressing higher within Minor Wave 3 Grey of Intermediate Wave (5) Orange against 1426. Aggressive traders could tighten risk further to 1600-10 range.

Invalidation point: 1426.

Chart

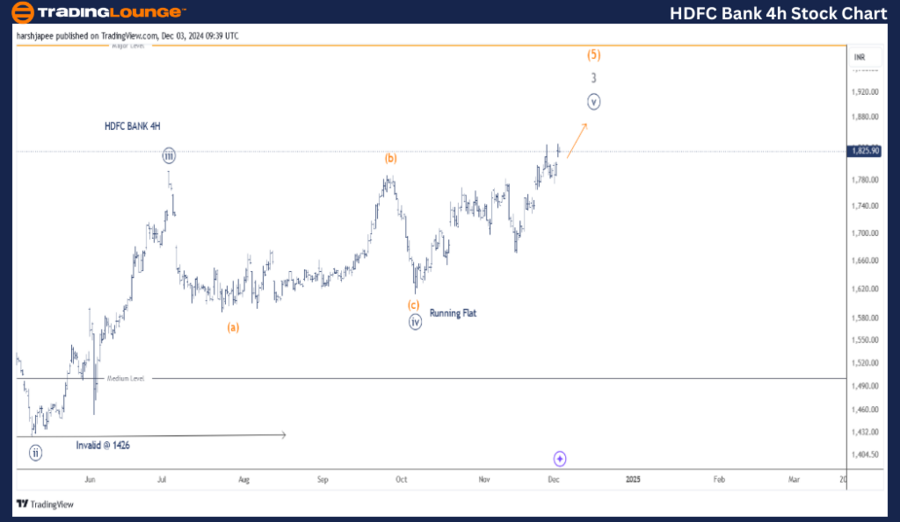
HDFC BANK four-hour chart technical analysis and potential Elliott Wave counts:

HDFC BANK 4H chart is primarily highlighting its sub waves from Minute Wave ((iii)), which completed around 1495 in July 2024. Minute Wave ((iv)) unfolded as a running flat terminating around 1610 mark. If the above holds well, Minute Wave ((v)) could be unfolding at the moment and possibly carve an impulse or a diagonal.

Conclusion:

HDFC BANK is progressing within Minute Wave ((v)) Navy of Minor Wave 3 Grey within Intermediate Wave (4) Orange against 1426.

Elliott Wave Analyst: Harsh Japee

HDFC Bank Elliott Wave technical analysis [Video]

Share: Feed news

As with any investment opportunity there is a risk of making losses on investments that Trading Lounge expresses opinions on.

Historical results are no guarantee of future returns. Some investments are inherently riskier than others. At worst, you could lose your entire investment. TradingLounge™ uses a range of technical analysis tools, software and basic fundamental analysis as well as economic forecasts aimed at minimizing the potential for loss.

The advice we provide through our TradingLounge™ websites and our TradingLounge™ Membership has been prepared without considering your objectives, financial situation or needs. Reliance on such advice, information or data is at your own risk. The decision to trade and the method of trading is for you alone to decide. This information is of a general nature only, so you should, before acting upon any of the information or advice provided by us, consider the appropriateness of the advice considering your own objectives, financial situation or needs. Therefore, you should consult your financial advisor or accountant to determine whether trading in securities and derivatives products is appropriate for you considering your financial circumstances.

Trading Pro
Read review
Pepperstone
Read review
Trading Pro
Read review
Pepperstone
Read review

Recommended content


Recommended content

Editors’ Picks

AUD/USD: Further gains need more conviction

AUD/USD: Further gains need more conviction

AUD/USD reversed two-daily pullbacks in a row on Tuesday, staging a decent comeback from Monday’s troughs near 0.6220 to the boundaries of the 0.6300 hurdle propped up by the RBA hawkish hold and firm data from Chinese business activity.

AUD/USD News
EUR/USD consolidates as traders holder their breath ahead of tariffs

EUR/USD consolidates as traders holder their breath ahead of tariffs

EUR/USD stuck to familiar levels on Tuesday, churning chart paper close to the 1.0800 handle as investors brace for US President Donald Trump’s long-threatened “reciprocal” tariffs package, due to be announced on Wednesday at 1900 GMT. 

EUR/USD News
Gold nears $3,100 as fears receded

Gold nears $3,100 as fears receded

Gold is easing from its fresh record high near $3,150 but remains well supported above the $3,100 mark. A generalised pullback in US yields is underpinning the yellow metal, as traders stay on the sidelines awaiting clarity on upcoming US tariff announcements.

Gold News
US Government to conclude BTC, ETH, XRP, SOL, and ADA reserves audit next Saturday

US Government to conclude BTC, ETH, XRP, SOL, and ADA reserves audit next Saturday

Bitcoin price rose 3% on Tuesday, as MicroStrategy, Metaplanet and Tether all announced fresh BTC purchase. However, BTC price is likely to remain volatile ahead of the anticipated disclosure of U.S. government crypto holdings, which could fuel speculation in the coming days. 

Read more
Is the US economy headed for a recession?

Is the US economy headed for a recession?

Leading economists say a recession is more likely than originally expected. With new tariffs set to be launched on April 2, investors and economists are growing more concerned about an economic slowdown or recession.

Read more
The Best brokers to trade EUR/USD

The Best brokers to trade EUR/USD

SPONSORED Discover the top brokers for trading EUR/USD in 2025. Our list features brokers with competitive spreads, fast execution, and powerful platforms. Whether you're a beginner or an expert, find the right partner to navigate the dynamic Forex market.

Read More

Forex MAJORS

Cryptocurrencies

Signatures

Best Brokers of 2025