HD Elliott Wave technical analysis [Video]
![HD Elliott Wave technical analysis [Video]](https://editorial.fxstreet.com/images/Markets/Equities/Nasdaq/nasdaq-amp-amex-16260859_XtraLarge.jpg)
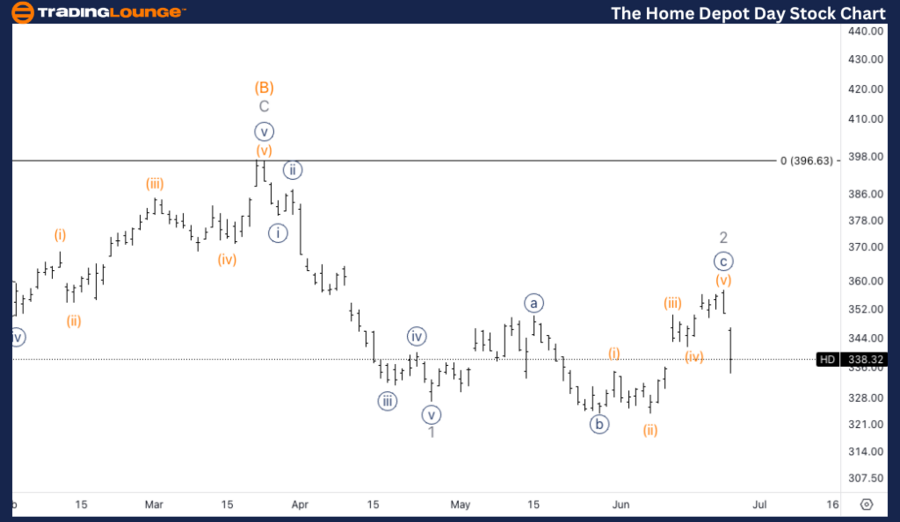
HD Elliott Wave Analysis Trading Lounge Daily Chart,
The Home Depot, (HD) Daily Chart.
HD Elliott Wave technical analysis
Function: Counter Trend.
Mode: Corrective.
Structure: ZigZag.
Position: Minor 3.
Direction: Acceleration in wave 3.
Details: It looks like we have completed a clear three wave move in Minor wave 2, which suggests we could be ready to resume the downtrend of the higher degree wave (C).
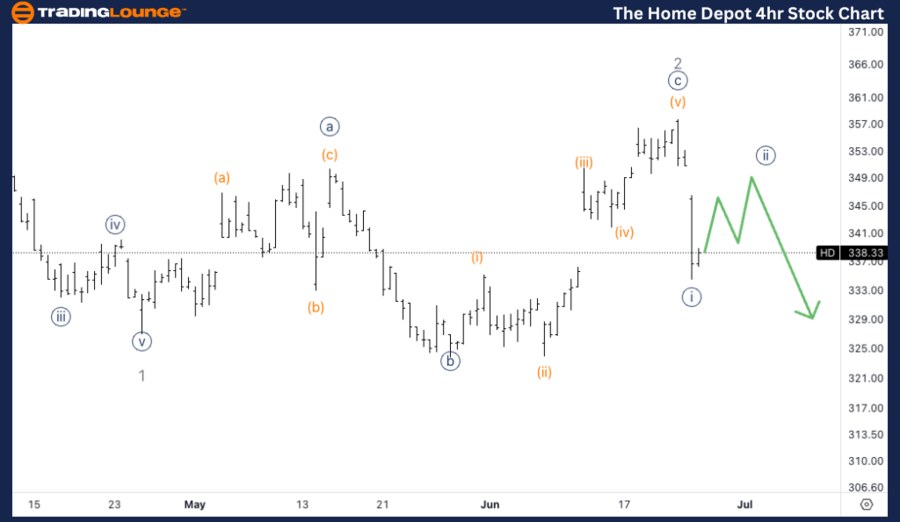
HD Elliott Wave Analysis Trading Lounge 4Hr Chart,
The Home Depot, (HD) 4Hr Chart.
HD Elliott Wave technical analysis
Function: Counter Trend.
Mode: Corrective.
Structure: ZigZag.
Position: Wave {i} of 3.
Direction: Pullback in {ii}.
Details: Looking for a pullback in minute wave {ii} of 3 to then continue lower. We could expect to find resistance on 350$, to then continue lower.
Welcome to our latest Elliott Wave analysis for The Home Depot, Inc. (HD). This analysis provides an in-depth look at HD's price movements using the Elliott Wave Theory, helping traders identify potential opportunities based on current trends and market structure. We will cover insights from both the daily and 4-hour charts to offer a comprehensive perspective on HD's market behavior.
HD Elliott Wave technical analysis – Daily chart
n our Elliott Wave analysis of The Home Depot, Inc. (HD), we observe a counter-trend corrective pattern characterized by a ZigZag structure. HD is currently positioned in Minor wave 3 of the higher degree wave (C). The recent price action indicates that HD has completed a clear three-wave corrective move in Minor wave 2, suggesting the possibility of resuming the downtrend in wave 3 of (C). This anticipated acceleration in wave 3 could lead to significant downward movement. Traders should monitor for bearish continuation patterns as HD progresses further into the downtrend phase of wave (C).
HD Elliott Wave technical analysis – Four-hour chart
On the 4-hour chart, HD is following a counter-trend corrective mode within a ZigZag structure, specifically in wave {i} of 3. The current analysis indicates that HD is experiencing a pullback in minute wave {ii} of 3. This pullback could find resistance around the $350 level before continuing the downward trajectory. The anticipated resistance at $350 could serve as a strategic point for traders to watch for signs of the downtrend resuming. A break below recent lows following this pullback would likely confirm the continuation of wave 3.
Technical analyst: Alessio Barretta.
HD Elliott Wave technical analysis [Video]
Author

Peter Mathers
TradingLounge
Peter Mathers started actively trading in 1982. He began his career at Hoei and Shoin, a Japanese futures trading company.


