HCL Technologies Elliott Wave technical analysis [Video]
![HCL Technologies Elliott Wave technical analysis [Video]](https://editorial.fxsstatic.com/images/i/General-Stocks_1_XtraLarge.png)
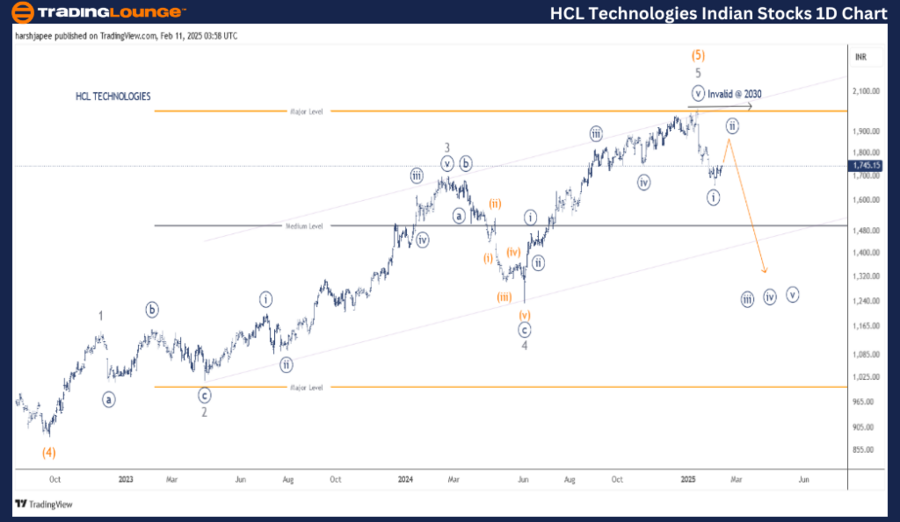
HCLTECH Elliott Wave technical analysis
Function: Counter Trend (Minor Degree, Grey).
Mode: Corrective.
Structure: Impulse within larger degree correction.
Position: Minute Wave ((i)) Navy.
Details: Minute Wave ((i)) looks complete around 1640-50 range. Expect a corrective rally towards 1900 zone before bears are back in control.
Invalidation point: 2030.
HCL Technologies daily chart technical analysis and potential Elliott Wave counts:
HCL TECHNOLOGIES daily chart is indicating a potential top in place around 2030 mark; termination on Intermediate Wave (5) Orange. The stock has reversed lower since then breaking below the 1750 initial support, marking Minute Wave ((i)) impulse. Much deeper correction lies ahead.
The stock had earlier dropped through 890 lows in September 2022 alongside global tech stocks. The rally thereafter is clearly seen in five waves at Minor degree labelled as Waves 1 through 5 terminating around 2030 in January 2025.
The trend has since reversed and bears are looking poised to remain in control as long as prices stay below 2030 mark.
HCLTECH Elliott Wave technical analysis
Function: Counter Trend (Minor Degree, Grey)
Mode: Corrective
Structure: Impulse within larger degree correction
Position: Minute Wave ((i)) Navy
Details: Minute Wave ((i)) looks complete around 1640-50 range, sub dividing into five waves at Minuette degree. Expect a corrective rally towards 1900 zone before bears are back in control.
Invalidation point: 2030

HCL Technologies four-hour chart technical analysis and potential Elliott Wave counts:
HCL TECHNOLOGIES 4H chart is highlighting the sub waves after Minute Wave ((iv)) of Minor Wave 5 Grey terminated around 1750 mark in November 2024. Minute Wave ((v)) unfolded as a diagonal, pushing through the 2030 mark.
The stock has dropped through 1665 lows since then, sub dividing as an impulse labelled as Minute Wave ((i)). If correct, Minute Wave ((ii)) is now underway towards 1850-1900 range, before bears are back in control. Prices should stay below 2030 for the above to remain valid.
Conclusion
HCL TECHNOLOGIES could be progressing to carve a corrective Minute Wave ((ii)) towards 1850 before turning lower again.
HCL Technologies Elliott Wave technical analysis [Video]
Author

Peter Mathers
TradingLounge
Peter Mathers started actively trading in 1982. He began his career at Hoei and Shoin, a Japanese futures trading company.


