Hang Seng Index Elliott Wave technical analysis [Video]
![Hang Seng Index Elliott Wave technical analysis [Video]](https://editorial.fxstreet.com/images/Markets/Equities/Ibex/bolsa-de-madrid-15680575_XtraLarge.jpg)
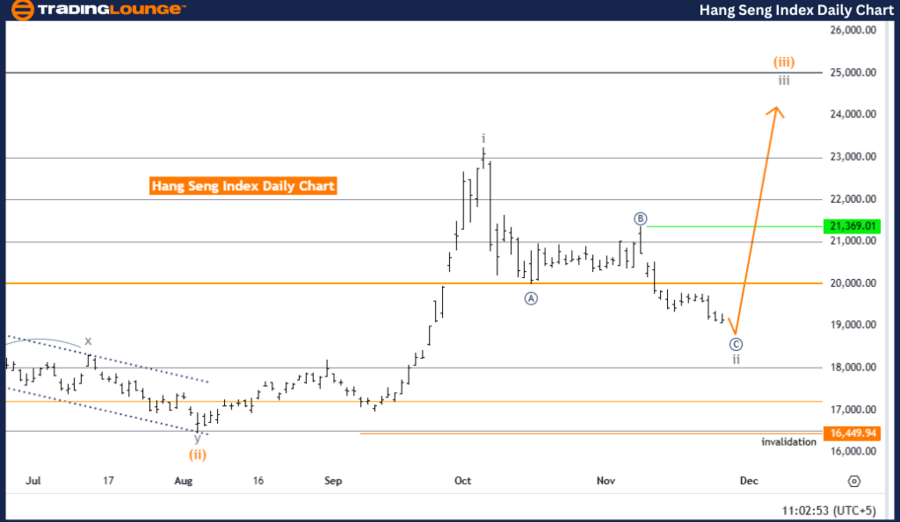
Hang Seng Index Elliott Wave Analysis – Trading Lounge Day Chart.
Hang Seng Index Elliott Wave technical analysis
-
Function: Counter Trend.
-
Mode: Corrective.
-
Structure: Gray Wave 2.
-
Position: Orange Wave 3.
-
Direction of next higher degrees: Gray Wave 3.
Details
Gray wave 1 appears to be complete, and gray wave 2 is currently in progress.
-
Wave Cancel Invalid Level: 16,449.94.
This analysis evaluates the Hang Seng Index using Elliott Wave theory on a daily chart. The market is currently in a counter-trend phase, signifying a temporary reversal within the broader trend. The primary structure under observation is gray wave 2, which started after the completion of gray wave 1. This phase represents the continuation of the corrective phase before the next impulsive wave begins.
The current position is within orange wave 3, a smaller wave inside the broader gray wave 2 corrective structure. This stage reflects ongoing counter-trend movement, with further development expected before transitioning into gray wave 3, which will mark the resumption of the upward impulsive trend.
Key threshold: Invalidation level
The invalidation level is defined at 16,449.94. If the index falls to this level, the current wave count and outlook will be invalidated. This threshold serves as a vital reference for traders, helping to confirm the corrective phase and manage risks effectively.
Conclusion
The Elliott Wave analysis suggests that the Hang Seng Index is currently in a counter-trend phase, with gray wave 2 actively unfolding. The completion of gray wave 1 confirmed the beginning of this corrective phase, while orange wave 3 represents the ongoing activity within the structure. The counter-trend outlook remains valid as long as the index stays above the invalidation level of 16,449.94. Further corrective movement is expected before transitioning to the impulsive phase associated with gray wave 3.
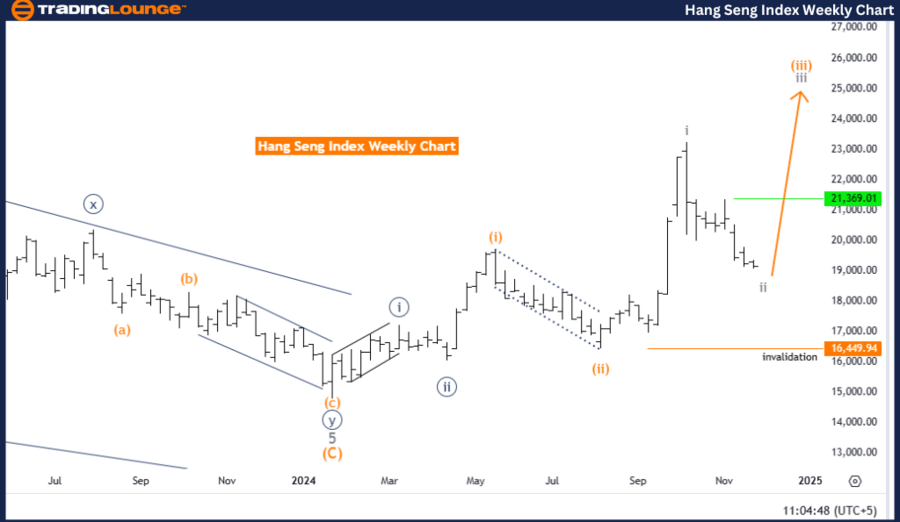
Hang Seng Index Elliott Wave Analysis – Trading Lounge Weekly Chart.
Hang Seng Index Elliott Wave technical analysis
-
Function: Counter Trend.
-
Mode: Corrective.
-
Structure: Gray Wave 2.
-
Position: Orange Wave 3.
-
Direction of next higher degrees: Gray Wave 3.
Details
Gray wave 1 appears to be complete, with gray wave 2 currently unfolding.
-
Wave Cancel Invalid Level: 16,449.94.
This analysis evaluates the Hang Seng Index using Elliott Wave theory on a weekly chart, highlighting a counter-trend phase. The market is currently in a corrective mode, indicating a temporary reversal within the larger trend. The primary structure under observation is gray wave 2, which began following the completion of gray wave 1. This phase marks the continuation of the corrective wave before the next impulsive phase begins.
At present, the index is positioned within orange wave 3, a smaller wave inside the larger gray wave 2 corrective structure. This phase signifies the ongoing progression of the counter-trend movement. Further development is expected before the index transitions to gray wave 3, resuming the upward impulsive trend.
Key threshold: Invalidation level
The invalidation level is specified at 16,449.94. If the index reaches this level, the current wave count and outlook will be invalidated. This level serves as a critical benchmark for traders to validate the corrective phase's structure and manage risks effectively.
Conclusion
The Elliott Wave analysis suggests that the Hang Seng Index is in a counter-trend phase, with gray wave 2 actively unfolding. The completion of gray wave 1 confirmed the start of this corrective phase, while orange wave 3 reflects the ongoing activity within it. The counter-trend outlook remains valid as long as the index stays above the invalidation level of 16,449.94. Continued corrective movement is expected before transitioning to the impulsive phase associated with gray wave 3.
Technical analyst: Malik Awais.
Hang Seng Index Elliott Wave technical analysis [Video]
Author

Peter Mathers
TradingLounge
Peter Mathers started actively trading in 1982. He began his career at Hoei and Shoin, a Japanese futures trading company.


