Hang Seng Index Elliott Wave technical analysis [Video]
![Hang Seng Index Elliott Wave technical analysis [Video]](https://editorial.fxstreet.com/images/Markets/Equities/HangSeng/hang-seng-index-17452117_XtraLarge.jpg)
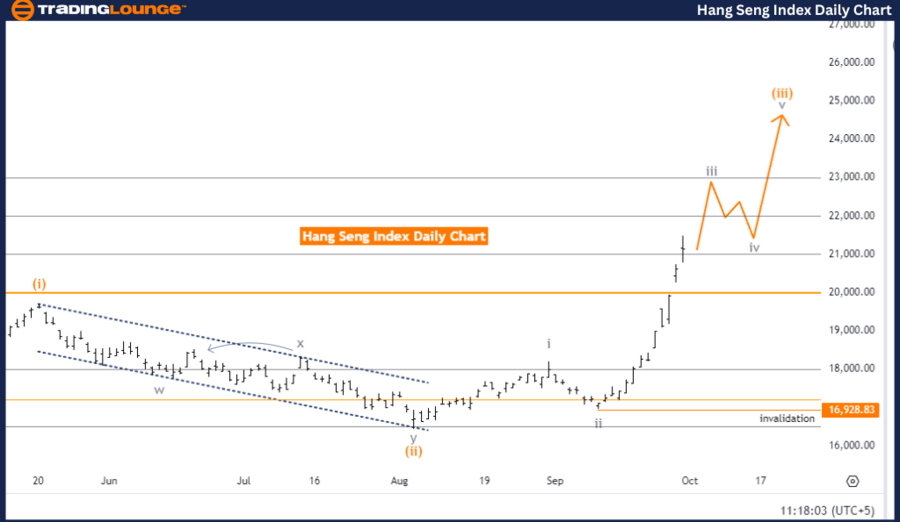
Hang Seng Index Elliott Wave analysis (daily chart)
Function: Trend.
Mode: Impulsive.
Structure: Gray Wave 3.
Position: Orange Wave 3.
Direction (next lower degrees): Gray Wave 4.
Details: Gray Wave 2 completed; Gray Wave 3 in progress.
Wave invalidation level: 16,928.83.
The Hang Seng Index Elliott Wave analysis for the daily chart suggests an impulsive trend, indicating strong directional movement. The structure currently under analysis is Gray Wave 3, part of the ongoing upward trend. This phase reflects a significant market advance.
At the moment, the Hang Seng Index is positioned in Orange Wave 3, aligned with the larger degree Gray Wave 3. The recent completion of Gray Wave 2 sets the stage for Gray Wave 3 to develop further, continuing the upward trend. In Elliott Wave Theory, Wave 3 is often the most dynamic and extended wave within an impulsive sequence, indicating that the market's upward movement will likely strengthen as Gray Wave 3 progresses.
The next expected phase will be Gray Wave 4, a corrective wave that typically follows the completion of Wave 3. However, since Gray Wave 3 is still in progress, the market is anticipated to continue moving higher before any correction begins. This suggests the current upward momentum will persist in the short term.
A key level to watch is the invalidation point of 16,928.83. If the market dips below this level, the current Elliott Wave analysis would be considered invalid, and the outlook on the trend would need to be reassessed. This invalidation level is crucial for traders, as it confirms whether the current trend remains intact.
Summary
The Hang Seng Index Elliott Wave analysis indicates a continuing impulsive trend, driven by Gray Wave 3. Traders should monitor the invalidation level of 16,928.83. As long as the market stays above this point, the bullish trend remains strong. A drop below this level would suggest the need for a re-evaluation of the market's direction.
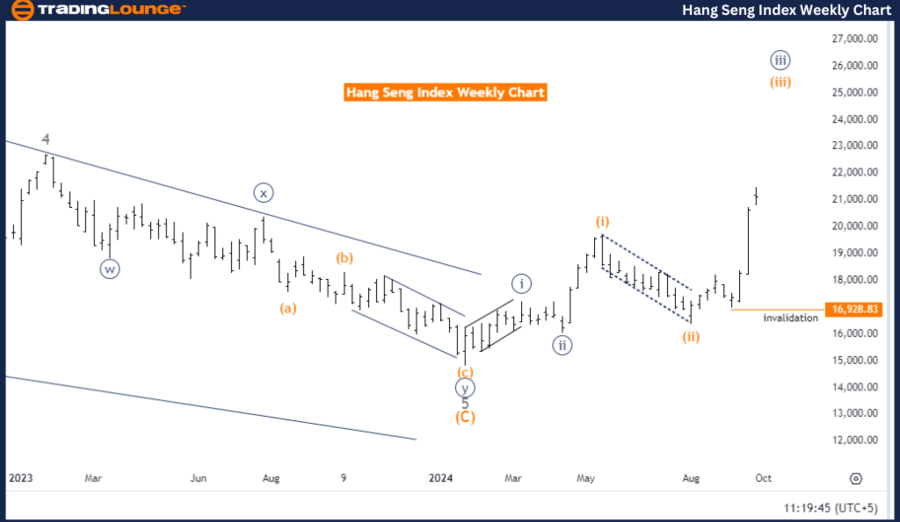
Hang Seng Index Elliott Wave analysis (weekly chart)
Function: Trend.
Mode: Impulsive.
Structure: Orange Wave 3.
Position: Navy Blue Wave 3.
Direction (next lower degrees): Orange Wave 4.
Details: Orange Wave 2 completed; Orange Wave 3 in progress.
Wave invalidation level: 16,928.83.
The Hang Seng Index Elliott Wave analysis for the weekly chart suggests an impulsive trend, indicating strong directional movement in the market. The structure currently being analyzed is Orange Wave 3, which forms a crucial part of the ongoing upward trend. This wave signals a continuation of the upward movement with significant momentum.
At present, the index is positioned in Navy Blue Wave 3, which aligns with the larger structure of Orange Wave 3. The recent completion of Orange Wave 2 has paved the way for the development of Orange Wave 3. According to Elliott Wave Theory, Wave 3 is typically the strongest and most extended phase within an impulsive trend, suggesting that the market will likely continue its upward trajectory as Orange Wave 3 unfolds.
The next anticipated phase is Orange Wave 4, a corrective wave that generally follows the completion of Wave 3. However, since Orange Wave 3 is still in progress, the bullish movement is expected to persist in the near term before any correction begins.
A critical level to watch is 16,928.83, which serves as the wave cancel invalidation point. If the market falls below this level, the current Elliott Wave analysis would be invalidated, requiring a re-evaluation of the trend. This invalidation level is key for traders, as it confirms whether the upward trend remains intact.
Summary
The Hang Seng Index Elliott Wave analysis for the weekly chart indicates a continued impulsive trend, driven by Orange Wave 3. Traders should closely monitor the 16,928.83 invalidation level. As long as the market stays above this point, the bullish trend is expected to persist. A drop below this level would necessitate a reassessment of the market's direction.
Hang Seng Index Elliott Wave technical analysis [Video]
Author

Peter Mathers
TradingLounge
Peter Mathers started actively trading in 1982. He began his career at Hoei and Shoin, a Japanese futures trading company.