Hang Seng Index Elliott Wave technical analysis [Video]
![Hang Seng Index Elliott Wave technical analysis [Video]](https://editorial.fxstreet.com/images/Markets/Equities/HangSeng/stock-market-38974104_XtraLarge.jpg)
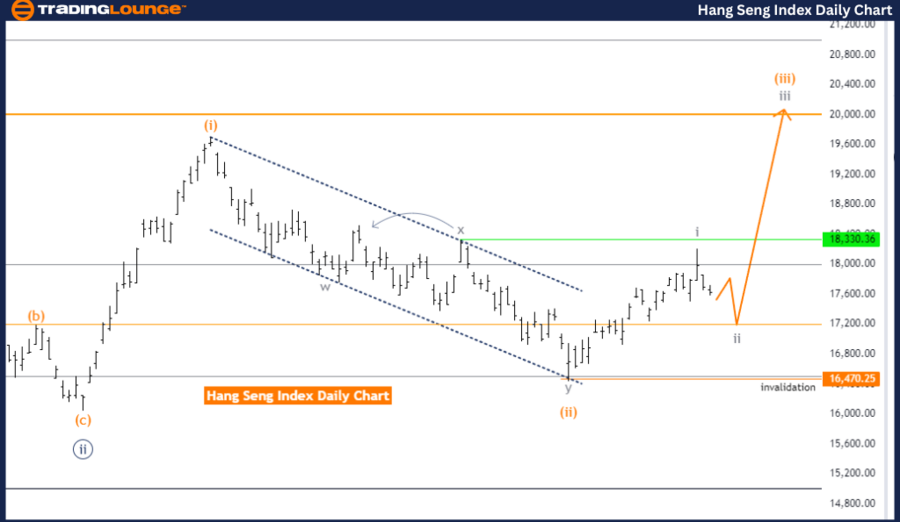
Hang Seng Index Elliott Wave analysis (daily chart)
Function: Counter Trend.
Mode: Corrective.
Structure: Gray Wave 2.
Position: Orange Wave 3.
Direction next higher degrees: Gray Wave 3.
Details: Gray Wave 1 is completed, with Gray Wave 2 currently unfolding.
Wave cancel invalidation level: 16,470.25.
The Hang Seng Index daily chart, analyzed through Elliott Wave principles, reveals that the market is in a counter-trend phase, operating in a corrective mode. The structure forming is Gray Wave 2, which comes after the completion of Gray Wave 1. This suggests that the market previously experienced an impulsive move during Gray Wave 1 but is now undergoing a corrective phase in Gray Wave 2.
Gray Wave 1 is marked as complete, indicating that the initial impulsive move has concluded. Presently, Gray Wave 2 is active, symbolizing a retracement or consolidation phase before the market potentially continues its next upward impulsive movement in Gray Wave 3. The position of Orange Wave 3 within this framework implies that the current corrective action is occurring within a broader trend.
The chart suggests that the market is preparing to continue the broader trend, with Gray Wave 3 anticipated to follow the conclusion of Gray Wave 2. This forthcoming wave is likely to signal a return to an impulsive move, pushing the market higher. However, until Gray Wave 2 is completed, the market remains in a corrective phase, adjusting from the initial impulsive action of Gray Wave 1.
The wave cancel invalidation level is set at 16,470.25. If the index drops below this level, the current Elliott Wave count would be invalidated, indicating a possible shift in market direction. As long as the index remains above this level, it is expected that the market is merely in a corrective phase before resuming its upward trend.
In summary: The Hang Seng Index is currently in a corrective phase with Gray Wave 2 in progress after the completion of Gray Wave 1. The market is expected to resume its upward trajectory in Gray Wave 3 after the corrective phase ends, provided the index stays above the wave cancel invalidation level of 16,470.25.
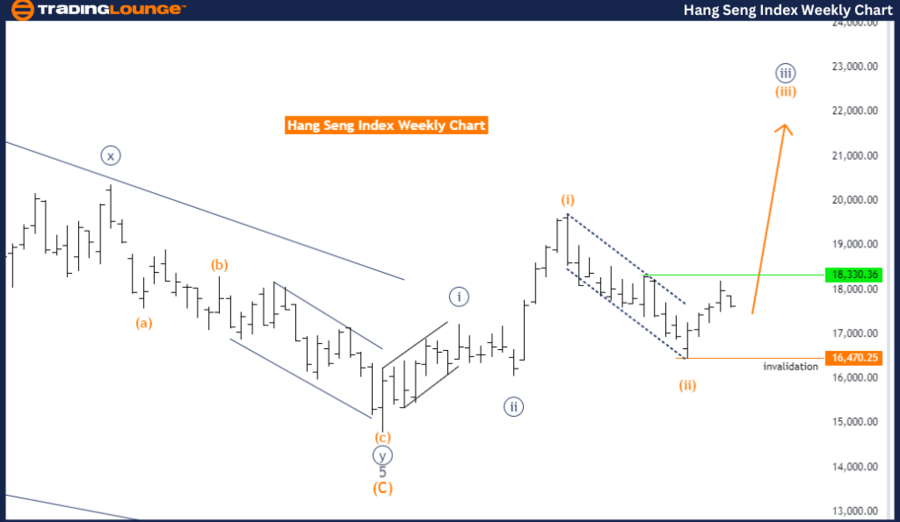
Hang Seng Index Elliott Wave analysis (weekly chart)
Function: Bullish Trend.
Mode: Impulsive.
Structure: Orange Wave 3.
Position: Navy Blue Wave 3.
Direction next higher degrees: Orange Wave 3 (Started).
Details: Orange Wave 2 is completed, with Orange Wave 3 now in progress.
Wave cancel invalidation level: 16,470.25.
The Hang Seng Index weekly chart, analyzed using Elliott Wave theory, reveals that the market is currently in a bullish trend. The mode is impulsive, indicating a strong upward movement. The current structure forming is Orange Wave 3, which follows the completion of Orange Wave 2.
Orange Wave 2 appears to have concluded, signaling the market's shift into Orange Wave 3. This transition from a corrective phase (Wave 2) to a new impulsive wave (Wave 3) suggests that the market is poised to continue its upward momentum. The presence of Navy Blue Wave 3 within this structure further reinforces the ongoing bullish trend.
The analysis indicates that the market is set to maintain its upward trajectory, driven by the development of Orange Wave 3. As long as the Hang Seng Index stays above the wave cancel invalidation level of 16,470.25, the current Elliott Wave count remains valid, supporting the expectation of continued bullish movement.
In summary: The Hang Seng Index weekly chart suggests that the market is in a bullish trend, with Orange Wave 3 currently unfolding after the completion of Orange Wave 2. The impulsive nature of this trend points to further upward movement, bolstered by the position of Navy Blue Wave 3. The wave cancel invalidation level of 16,470.25 is a critical threshold; as long as the market remains above this level, the bullish outlook is expected to persist, with further gains anticipated as Orange Wave 3 progresses.
Hang Seng Index Elliott Wave technical analysis [Video]
Author

Peter Mathers
TradingLounge
Peter Mathers started actively trading in 1982. He began his career at Hoei and Shoin, a Japanese futures trading company.