Hang Seng Index Elliott Wave technical analysis [Video]
![Hang Seng Index Elliott Wave technical analysis [Video]](https://editorial.fxstreet.com/images/Markets/Equities/close-up-of-stock-certificate-7978488_XtraLarge.jpg)
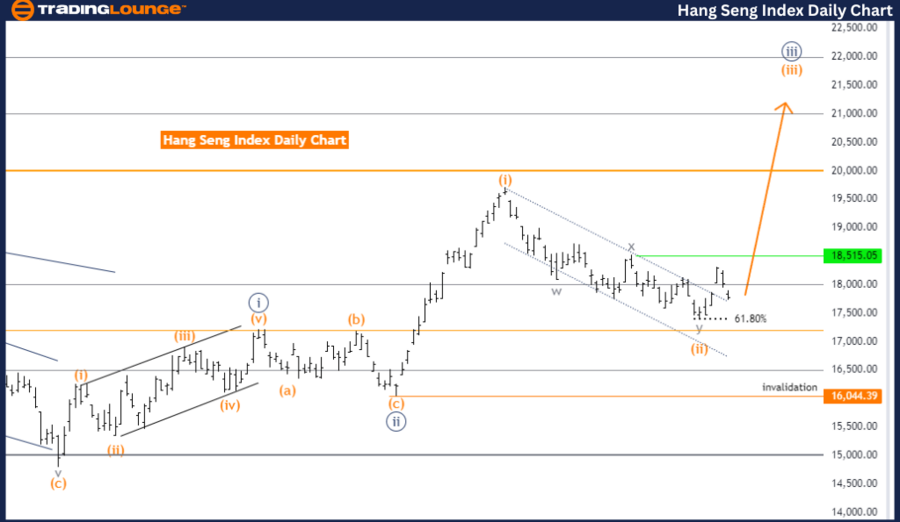
Hang Seng Index: Elliott Wave Analysis Day Chart.
Hang Seng Index Elliott Wave technical analysis
Function: Trend.
Mode: Impulsive.
Structure: Orange Wave 3.
Position: Navy Blue Wave 3.
Direction next higher degrees: Orange Wave 3 (started).
Details: Orange wave 2 looks completed. Now orange wave 3 of 3 is in play.
Wave cancel invalid level: 16044.39.
The Hang Seng Index Elliott Wave Analysis for the day chart provides a detailed examination of the market's current trends and wave patterns. The analysis identifies the market's movement as part of an overall trend, indicating an impulsive mode rather than a corrective one.
The specific wave structure under scrutiny is orange wave 3, which forms part of a larger navy blue wave 3. This suggests that the market is currently experiencing an upward trend characterized by successive impulsive waves. According to the analysis, orange wave 2 has completed, marking the end of the corrective phase within navy blue wave 3. With orange wave 2 concluded, the market has now entered orange wave 3, which is in progress.
The direction anticipated next in this analysis is the continuation of orange wave 3, signaling further upward movement in the market. This phase, orange wave 3 of 3, indicates a strong impulsive trend within the broader wave structure, suggesting that the market is expected to continue its rise as part of the ongoing navy blue wave 3.
An essential component of this analysis is the wave cancel invalid level, set at 16044.39. This level serves as a crucial reference point for traders, determining the validity of the current wave count. Should the market price move below this level, the existing wave analysis would be invalidated, necessitating a reassessment of the market's condition and potential strategic adjustments. This invalidation level is critical for risk management, providing traders with a clear threshold to monitor and ensuring that the wave analysis remains accurate.
In summary, the Hang Seng Index day chart analysis identifies an upward trend in an impulsive mode characterized by orange wave 3 within navy blue wave 3. Orange wave 2 has been completed, and the market is now experiencing orange wave 3 of 3. The wave cancellation invalid level at 16044.39 is crucial for maintaining the accuracy of the current wave count and for effective risk management.

Hang Seng Index: Elliott Wave Analysis Weekly Chart.
Hang Seng Index Elliott Wave technical analysis
Function: Trend.
Mode: Impulsive.
Structure: Orange Wave 3.
Position: Navy Blue Wave 3.
Direction next higher degrees: Orange Wave 3 (started).
Details: Orange wave 2 looks completed. Now orange wave 3 of 3 is in play.
Wave cancel invalid level: 16044.39.
The Hang Seng Index Elliott Wave Analysis for the weekly chart focuses on the current trend and wave patterns in the market. The analysis identifies the market's movement as part of an impulsive trend rather than a corrective one, suggesting strong upward momentum.
The primary wave structure being analyzed is orange wave 3, situated within a larger navy blue wave 3. This indicates a significant upward trend driven by successive impulsive waves. According to the analysis, orange wave 2 has been completed, marking the end of the recent corrective phase within navy blue wave 3. With orange wave 2 concluded, the market has entered orange wave 3, which is currently in progress.
The expected direction in this analysis is the continuation of orange wave 3, suggesting further upward movement in the market. This phase, orange wave 3 of 3, points to a strong impulsive trend within the broader wave structure, implying that the market is likely to continue its rise as part of the ongoing navy blue wave 3.
An important aspect of this analysis is the wave cancel invalid level, set at 16044.39. This level serves as a crucial reference point for traders, determining the validity of the current wave count. If the market price moves below this level, the existing wave analysis would be invalidated, requiring a reassessment of the market's condition and potential strategic adjustments. This invalidation level is vital for risk management, providing traders with a clear threshold to monitor and ensuring that the wave analysis remains accurate.
In summary, the Hang Seng Index weekly chart analysis identifies a strong upward trend in an impulsive mode, characterized by orange wave 3 within navy blue wave 3. Orange wave 2 has been completed, and the market is now experiencing orange wave 3 of 3. The wave cancel invalid level at 16044.39 is critical for maintaining the accuracy of the current wave count and for effective risk management.
Technical analyst: Malik Awais
Hang Seng Index Elliott Wave technical analysis [Video]
Author

Peter Mathers
TradingLounge
Peter Mathers started actively trading in 1982. He began his career at Hoei and Shoin, a Japanese futures trading company.


