Hang Seng Index Elliott Wave technical analysis [Video]
![Hang Seng Index Elliott Wave technical analysis [Video]](https://editorial.fxstreet.com/images/Markets/Equities/HangSeng/hang-seng-index-17354816_XtraLarge.jpg)
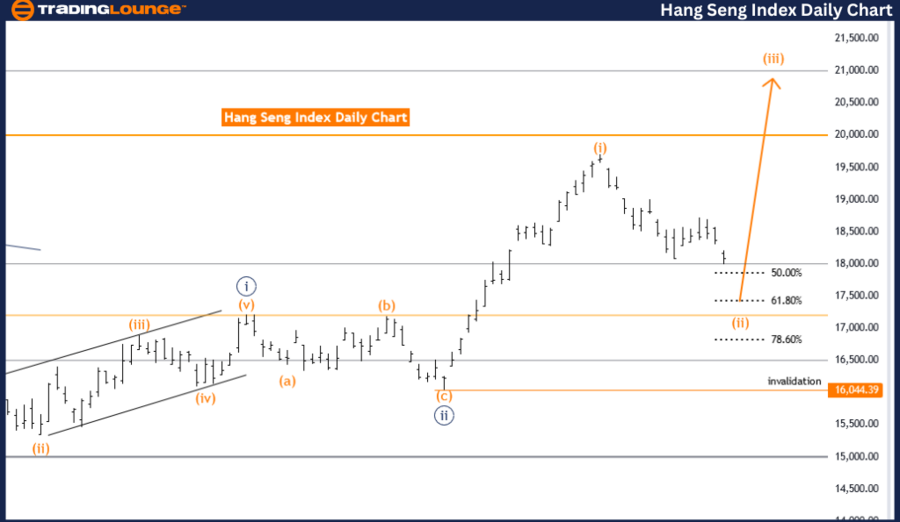
Hang Seng Index Elliott Wave Analysis Trading Lounge Day Chart,
Hang Seng Index Elliott Wave technical analysis
Function: Trend.
Mode: Corrective.
Structure: Orange wave 2.
Position: Navy blue wave 3.
Direction next higher degrees: Orange wave 3.
Details: Orange wave 2 still is in play, after that orange wave 3 will start.
Wave cancel invalid level: 16044.39.
The Hang Seng Index Elliott Wave analysis on the weekly chart focuses on identifying the trend within a corrective phase. The current wave structure is classified as orange wave 2, which is part of the larger navy blue wave 3. This analysis suggests that the market is undergoing a corrective wave before potentially resuming its primary trend direction.
The function of this analysis is to track the trend, with the mode specified as corrective. This indicates that the market is experiencing a reversal or consolidation within the larger trend. The specific structure under observation is orange wave 2, indicating that the correction is still ongoing and has not yet concluded.
The current market activity is positioned within navy blue wave 3, which typically follows a significant upward movement marked by navy blue wave 2. The market is expected to complete the corrective phase of orange wave 2 before transitioning into the next phase, orange wave 3, which usually signifies a return to the primary trend direction.
The direction for the next higher degrees is identified as orange wave 3, suggesting an anticipated upward movement following the completion of the current corrective wave. This implies that once orange wave 2 concludes, the market should resume its upward trend, moving into a more impulsive phase.
A critical aspect of this analysis is the wave cancel invalid level, set at 16044.39. This level is essential for maintaining the validity of the current wave count. If the market price drops below this level, it would invalidate the existing wave structure, necessitating a reassessment of the Elliott Wave analysis and potentially altering the expected market direction.
In summary, the Hang Seng Index weekly chart analysis indicates the market is in a corrective phase, specifically within orange wave 2 of navy blue wave 3. This phase is expected to conclude before the market resumes its primary trend direction with orange wave 3. The wave cancel invalid level at 16044.39 is crucial for the validity of the current wave count, guiding traders in anticipating future market movements based on the Elliott Wave principles.
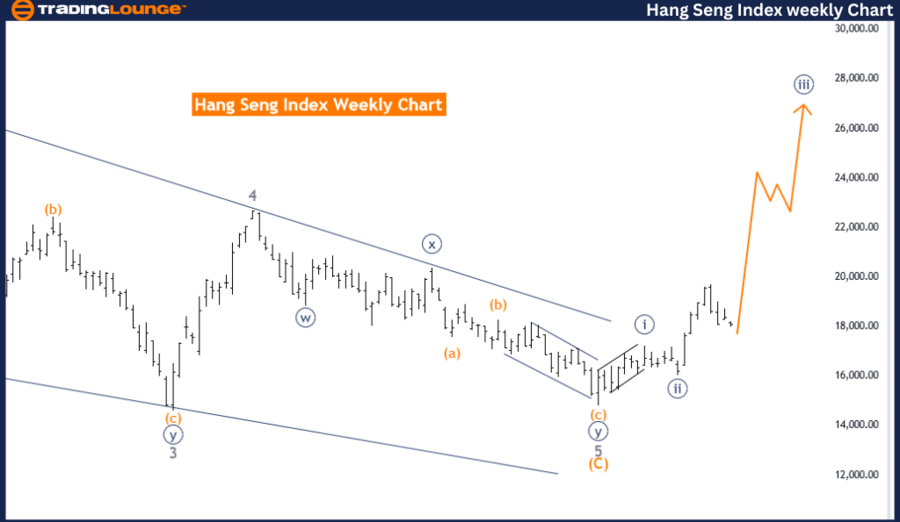
Hang Seng Index Elliott Wave analysis weekly chart
Function: Trend.
Mode: Impulsive.
Structure: Navy blue wave 3.
Position: Gray wave 1.
Direction next higher degrees: Navy blue wave 3 (continue).
Details: Navy blue wave looking completed at 16044.39, now navy blue wave 3 is in play.
Wave cancel invalid level: 16044.39.
The Hang Seng Index Elliott Wave analysis on the weekly chart identifies the trend within an impulsive phase. The current wave structure is classified as navy blue wave 3, which is positioned within gray wave 1. This analysis indicates that the market is experiencing an upward movement, characteristic of an impulsive wave pattern.
The function of this analysis is to track the trend, with the mode specified as impulsive. This suggests that the market is in a strong, directional phase, typically associated with significant price movements. The specific structure under observation is navy blue wave 3, indicating that the market is in the midst of an upward trend.
The current market activity is positioned within gray wave 1, which marks the beginning of the next impulsive sequence within navy blue wave 3. This placement suggests that the market has recently completed a significant movement, as indicated by the completion of navy blue wave 2, and is now progressing through navy blue wave 3.
The direction for the next higher degrees is identified as the continuation of navy blue wave 3. This indicates that the market is expected to maintain its upward trajectory, reinforcing the impulsive nature of the current wave structure. Traders can anticipate further upward movement as the market progresses through this phase.
A critical aspect of this analysis is the wave cancel invalid level, set at 16044.39. This level is essential for maintaining the validity of the current wave count. If the market price drops below this level, it would invalidate the existing wave structure, necessitating a reassessment of the Elliott Wave analysis and potentially altering the expected market direction.
In summary, the Hang Seng Index weekly chart analysis shows the market is in an impulsive phase, specifically within navy blue wave 3 of gray wave 1. This phase is expected to continue, with further upward movement anticipated. The wave cancel invalid level at 16044.39 is crucial for the validity of the current wave count, guiding traders in their expectations of future market movements based on the Elliott Wave principles.
Hang Seng Index Elliott Wave technical analysis [Video]
Author

Peter Mathers
TradingLounge
Peter Mathers started actively trading in 1982. He began his career at Hoei and Shoin, a Japanese futures trading company.


