Hang Seng Index Elliott Wave technical analysis [Video]
![Hang Seng Index Elliott Wave technical analysis [Video]](https://editorial.fxstreet.com/images/Markets/Equities/HangSeng/hang-seng-index-37745936_XtraLarge.jpg)
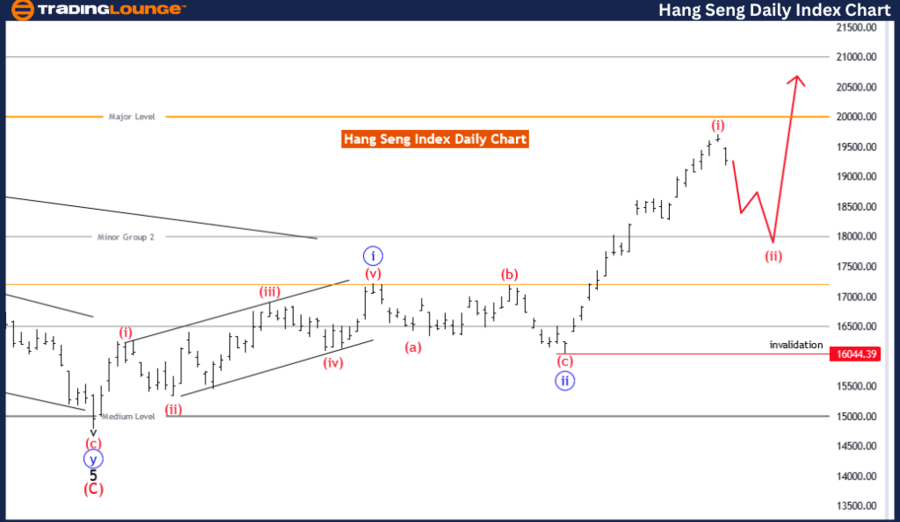
Hang Seng Index Elliott Wave Analysis Trading Lounge Day Chart,
Hang Seng Index Elliott Wave technical analysis
Function: Trend.
Mode: Corrective.
Structure: Red wave 2.
Position: Blue wave 3.
Direction next higher degrees: Red wave 3.
Details: Red wave 1 looking completed at 19787.10. Now red wave 2 of 3 is in play.
Wave cancel invalid level: 16044.39.
The Elliott Wave analysis for the Hang Seng Index on the daily chart provides a comprehensive view of its current trend movements. The analysis characterizes the overall function as a trend, indicating that the Hang Seng Index is following a recognizable and sustained directional movement.
The mode of this trend is described as corrective, which typically involves a temporary counter-move against the prevailing trend. Within this corrective mode, the primary structure identified is red wave 2, suggesting that the index is currently in the second wave of a corrective phase.
At present, the position within this structure is blue wave 3, indicating that the market is part of a larger corrective sequence moving through the red wave 2 phase. This positioning is crucial as it determines the immediate market behavior and potential future movements.
The direction for the next higher degrees is projected to be red wave 3, implying that after the completion of the current corrective phase (red wave 2), the market is expected to enter a more significant upward trend in red wave 3. This transition from corrective to impulsive phases often marks a pivotal shift in market sentiment.
Key details highlighted include the completion of red wave 1 at a specific level, indicating that the initial corrective move has concluded. Currently, red wave 2 of 3 is in play, marking the ongoing corrective phase before the anticipated transition to red wave 3. This phase is critical as it sets the stage for the next major market movement.
An important aspect of this analysis is the wave cancel invalid level, set at 16044.39. If the market price moves beyond this level, it would invalidate the current wave count and necessitate a re-evaluation of the wave structure. This level serves as a crucial checkpoint for confirming the accuracy of the Elliott Wave pattern and the expected market behavior.
In summary, the Hang Seng Index is currently in a corrective trend within red wave 2 of blue wave 3. The completion of red wave 1 sets the stage for the ongoing red wave 2, with the market expected to transition into red wave 3. Monitoring the invalidation level is essential to validate the current wave count and anticipated market movements.
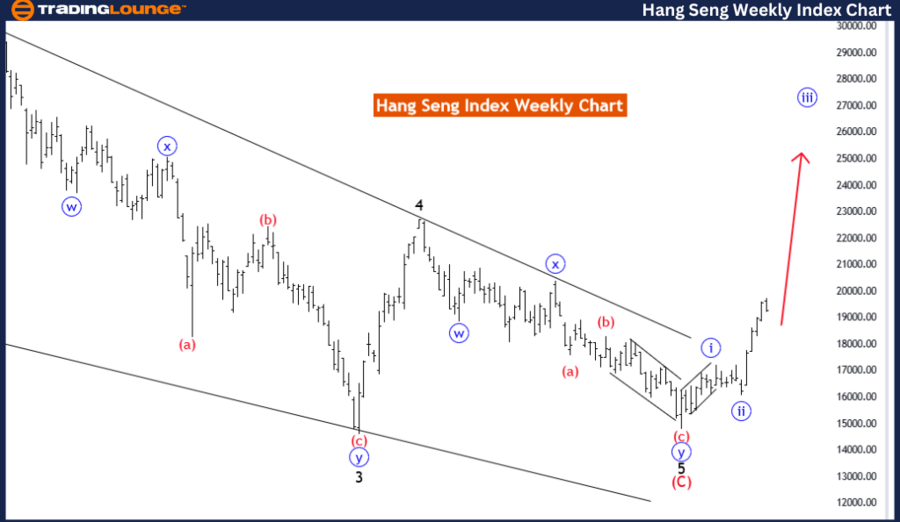
Hang Seng Index Elliott Wave analysis weekly chart
Function: Trend.
Mode: Impulsive.
Structure: Blue wave 3.
Position: Black wave.
Direction next lower degrees: Blue wave 4.
Details: Blue wave 2 looking completed at 16044.39. Now blue wave 3 is in play.
Wave cancel invalid level: 14780.30.
The Elliott Wave analysis for the Hang Seng Index on the weekly chart provides insights into its current trend dynamics. The analysis identifies the overall function as a trend, suggesting that the index is in a sustained directional movement.
The mode of this trend is characterized as impulsive, indicating strong, decisive movements that are in the direction of the larger trend. Within this impulsive mode, the primary structure identified is blue wave 3. This suggests that the index is currently in the third wave of an impulsive sequence, which typically involves the most significant and powerful movements within an Elliott Wave cycle.
The current position within this structure is black wave 1, indicating that the market is in the initial phase of the blue wave 3 sequence. This phase is critical as it sets the foundation for subsequent waves and often involves substantial price movements.
The direction for the next lower degrees is projected to be blue wave 4, implying that after the completion of the current blue wave 3, the market is expected to enter a corrective phase in blue wave 4. This transition is significant as it often involves a retracement of the prior impulsive move before resuming the trend.
Key details in the analysis highlight the completion of blue wave 2 at a specific level, indicating that the corrective phase preceding the current impulsive move has concluded. Now, blue wave 3 is in play, marking the ongoing impulsive phase that follows blue wave 2. This phase is crucial as it often represents the strongest part of the Elliott Wave cycle.
An important aspect of the analysis is the wave cancel invalid level, set at 14780.30. If the market price moves beyond this level, it would invalidate the current wave count and necessitate a re-evaluation of the wave structure. This level serves as a critical checkpoint for confirming the accuracy of the Elliott Wave pattern and the expected market behavior.
In summary, the Hang Seng Index is currently in an impulsive trend within blue wave 3 of black wave 1. The completion of blue wave 2 sets the stage for the ongoing blue wave 3, with the market expected to transition into blue wave 4 next. Monitoring the invalidation level is essential to validate the current wave count and anticipated market movements.
Hang Seng Index Elliott Wave technical analysis [Video]
Author

Peter Mathers
TradingLounge
Peter Mathers started actively trading in 1982. He began his career at Hoei and Shoin, a Japanese futures trading company.