Hang Seng Elliott Wave technical analysis [Video]
![Hang Seng Elliott Wave technical analysis [Video]](https://editorial.fxsstatic.com/images/i/Equity-Index_NIKKEI-2_XtraLarge.jpg)
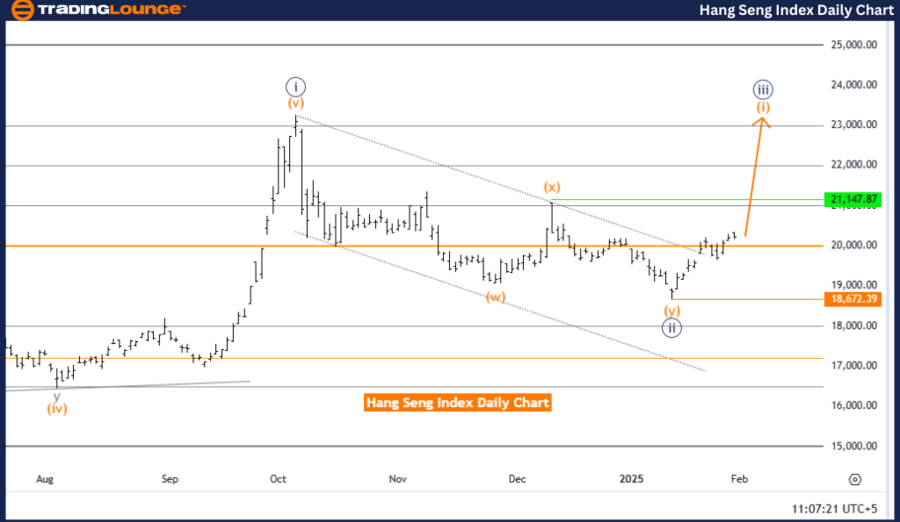
Hang Seng Index Elliott Wave analysis – Trading Lounge day chart
Hang Seng Index Elliott Wave technical analysis
Technical analysis overview
-
Function: Bullish Trend.
-
Mode: Impulsive.
-
Structure: Orange Wave 1.
-
Position: Navy Blue Wave 3.
-
Next higher degree direction: Orange Wave 1 (initiated).
-
Details: Navy Blue Wave 2 appears to have completed, with Orange Wave 1 of 3 now in progress.
-
Wave cancel invalidation level: 18,672.39.
Analysis overview
This analysis evaluates the Hang Seng Index using Elliott Wave Theory on a daily chart, emphasizing a bullish trend in an impulsive mode. The primary wave structure under observation is Orange Wave 1, which has initiated following the apparent completion of Navy Blue Wave 2. This signals the continuation of a robust upward trend.
Currently, the index is positioned within Navy Blue Wave 3, reflecting sustained bullish momentum. The conclusion of Navy Blue Wave 2 indicates that the corrective phase has ended, making way for the development of Orange Wave 1 of 3. This wave represents the next impulsive phase, likely to drive further upward movement in the market.
The invalidation level for this wave count is set at 18,672.39. A decline below this threshold would invalidate the current wave structure and necessitate a reassessment of the analysis and the overall market outlook.
Summary
The daily chart analysis for the Hang Seng Index outlines a bullish trend, led by the progression of Orange Wave 1 within Navy Blue Wave 3. The completion of Navy Blue Wave 2 and the active position within Orange Wave 1 of 3 suggest renewed upward momentum.
The expected continuation of impulsive movements at higher degrees aligns with a bullish market outlook. The invalidation level serves as a key point for managing risks and validating the wave count. This analysis provides traders with actionable insights into the ongoing bullish trend, enabling them to align strategies with the market's upward trajectory while monitoring critical levels for potential adjustments.
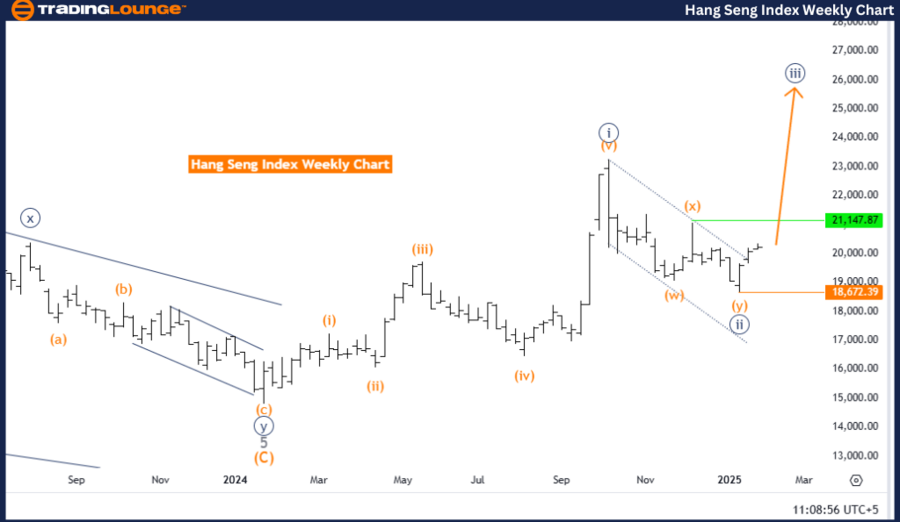
Hang Seng Index Elliott Wave analysis – Trading Lounge weekly chart.
Hang Seng Index Elliott Wave technical analysis
Technical analysis overview
-
Function: Bullish Trend.
-
Mode: Impulsive.
-
Structure: Navy Blue Wave 3.
-
Position: Gray Wave 1.
-
Next higher degree direction: Navy Blue Wave 3 (initiated).
-
Details: Navy Blue Wave 2 appears to have completed, and Navy Blue Wave 3 is now in progress.
-
Wave cancel invalidation level: 18,672.39.
Analysis overview
This analysis examines the Hang Seng Index using Elliott Wave Theory on a weekly chart, highlighting a bullish trend with an impulsive mode. The primary structure under observation is Navy Blue Wave 3, which has started following the apparent completion of Navy Blue Wave 2. This signals a renewed upward trend in the market.
The index is currently positioned within Gray Wave 1, part of the broader Navy Blue Wave 3 structure. The completion of Navy Blue Wave 2 indicates the end of the corrective phase, setting the stage for the active development of Navy Blue Wave 3. This wave is expected to sustain bullish momentum, driving the market higher as part of the ongoing impulsive cycle.
The invalidation level for this wave count is set at 18,672.39. A drop below this level would invalidate the current wave structure and necessitate a reevaluation of the market outlook and wave analysis.
Summary
The weekly chart analysis for the Hang Seng Index highlights a strong bullish trend, driven by the progression of Navy Blue Wave 3. The completion of Navy Blue Wave 2 and the current position within Gray Wave 1 signal a transition to renewed upward momentum.
The anticipated continuation of higher-degree impulsive movements aligns with a bullish market outlook. The invalidation level serves as a critical reference for managing risks and validating the wave count. This structured analysis provides valuable insights for traders, helping them align strategies with the market's upward trajectory while monitoring key levels for potential adjustments.
Hang Seng Elliott Wave technical analysis [Video]
Author

Peter Mathers
TradingLounge
Peter Mathers started actively trading in 1982. He began his career at Hoei and Shoin, a Japanese futures trading company.


