GX Uranium ETF (URA) Elliott Wave technical analysis [Video]
![GX Uranium ETF (URA) Elliott Wave technical analysis [Video]](https://editorial.fxstreet.com/images/Markets/Equities/Industries/Transportation/airplane-refueling-637435358050901524_XtraLarge.jpg)
GX Uranium ETF (URA) Elliott Wave analysis
Function - Counter trend.
Mode - Corrective.
Structure - Emerging Zigzag.
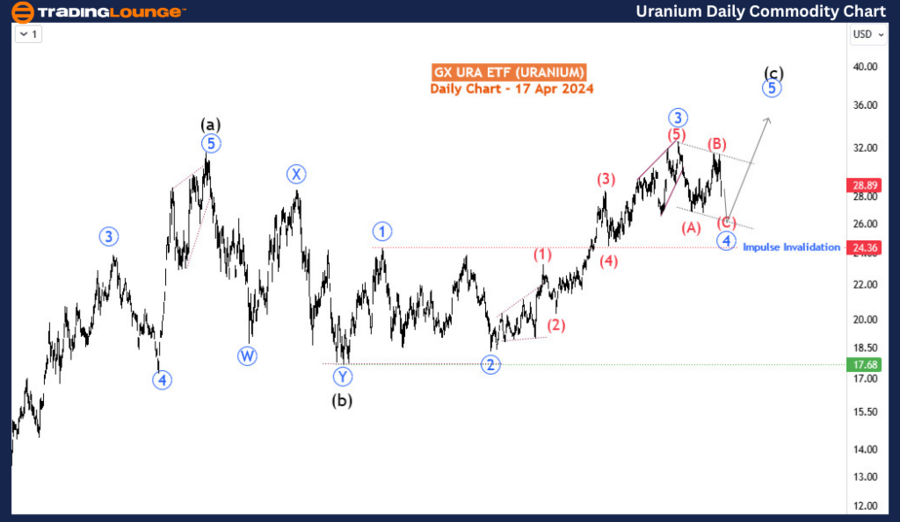
Position - Red wave (C) of blue 4.
Direction - Red wave (C) of blue 4 is still in play.
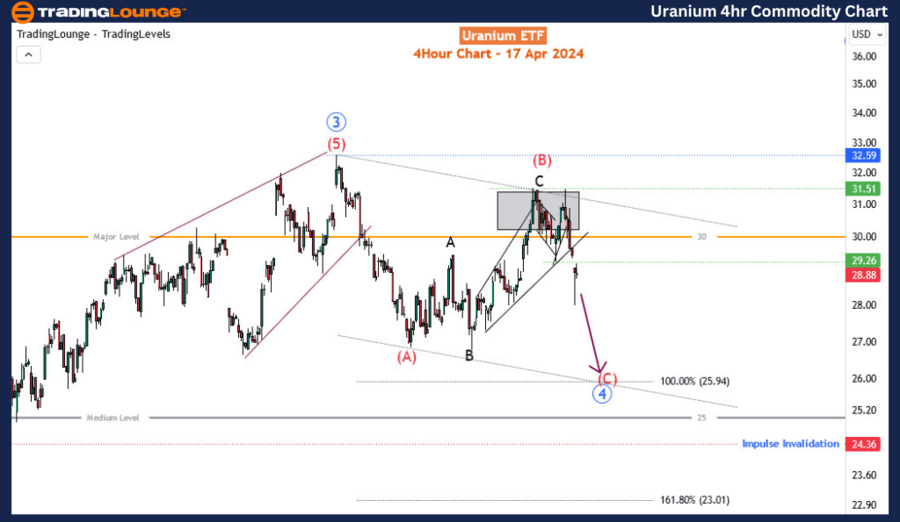
Details - Price broke blow 30. Wave (C) was confirmed by the break below 29.26. Should extend toward 25.94.
The GX Uranium ETF is an exchange-traded fund (ETF) that focuses on investing in companies involved in the uranium industry. Uranium is a key component in nuclear power generation, and its demand is influenced by factors such as global energy needs, environmental concerns, and government policies regarding nuclear power.
Recent market movements have seen the GX Uranium ETF undergo a bearish correction, with a decline exceeding 5% over the current trading week. This downturn commenced on February 1st, 2023, and is anticipated to persist in the short term before encountering a support level, heralding the onset of renewed upward momentum. Notably, this correction unfolds within the broader context of a bullish trend that commenced in March 2022. Despite enduring an over 8-month pullback between November 2021 and July 2022, the ETF has steadily ascended, reaching its loftiest valuation since April 2014. Consequently, post the prevailing retracement, a resumption of the bullish trajectory is anticipated.
Analyzing the daily time frame reveals a discernible bullish impulse of the cycle degree (marked in blue) after the supercycle wave (b). The termination of the 3rd wave - designated as blue wave 3 - occurred in February 2023, characterized by a diagonal pattern, followed by the onset of the corresponding 4th wave. This 4th wave manifests as a zigzag pattern, navigating through wave (C) after completing wave (B) via an expanding diagonal. To maintain the integrity of the overall impulse structure, the 4th wave - delineated as blue wave 4 - must remain above the critical level of 24.36. Expectations converge on buyers eagerly awaiting the conclusion of wave (C) to propel the bullish momentum into the 5th wave.
Examining the H4 chart illuminates the sub-waves of (A)-(B)-(C) and the emergence of wave (C). The initial target for wave (C) aligns with the 100% extension of wave (A) at 25.94, slightly above the psychological barrier of 25. Traders are thus advised to anticipate the culmination of wave (C) within the 25.94-25 zone, paving the way for subsequent rallies.
Technical analyst: Sanmi Adeagbo.
GX Uranium ETF (URA) Elliott Wave analysis [Video]
Author

Peter Mathers
TradingLounge
Peter Mathers started actively trading in 1982. He began his career at Hoei and Shoin, a Japanese futures trading company.


