Grasim Industries Indian stocks Elliott Wave technical analysis [Video]
![Grasim Industries Indian stocks Elliott Wave technical analysis [Video]](https://editorial.fxsstatic.com/images/i/Equity-Index_S&P500-1_XtraLarge.jpg)
GRASIM (one day chart) Elliott Wave technical analysis
Function: Counter Trend Lower (Minor Degree Grey).
Mode: Corrective.
Structure: Potential Zigzag or Impulse within Larger Degree Correction.
Position: Minute Wave ((iii) Navy.
Details: A potential larger degree correction could be underway against 2880.
An interim low is in place around 2300 as prices pullback. Resistance comes around 2500-2600 mark for bears to come back in control.
Invalidation point: 2880.
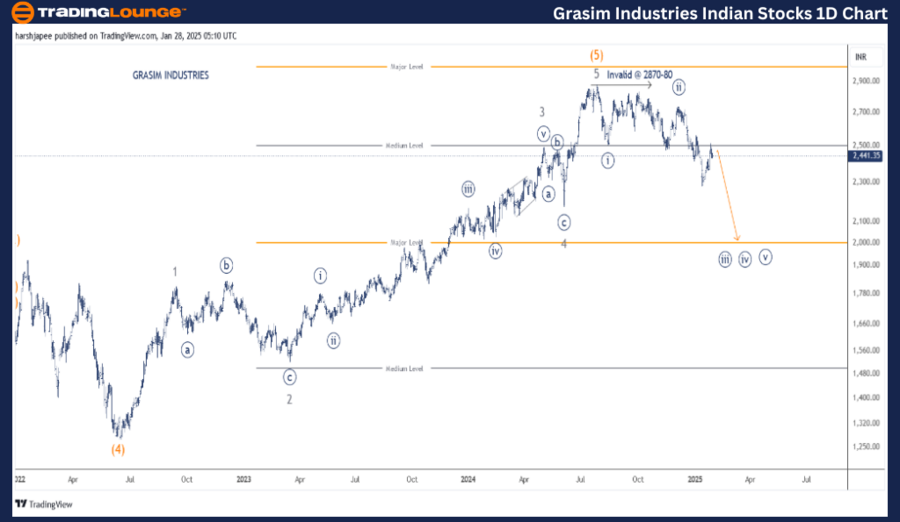
GRASIM daily chart technical analysis and potential Elliott Wave counts:
GRASIM daily chart is indicating a major top could be in place around 2880 in July 2024, terminating Intermediate Wave (5) Orange. The stock seems to be progressing lower since then in an impulse wave at a Minute degree. Waves ((i)) and ((ii)) cold be in place around 2510 and 2740 respectively.
The stock is now progressing within Minute Wave ((iii)) and could be an extension. Ideally prices should stay below 2740 mark for bears to remain in control. An alternate scenario could be a corrective wave is now complete around 2275 and bulls are back in control.
GRASIM (four-hour chart) Elliott Wave technical analysis
Function: Counter Trend Lower (Minor Degree Grey).
Mode: Corrective.
Structure: Potential Zigzag or Impulse within Larger Degree Correction.
Position: Minute Wave ((iii) Navy.
Details: A potential larger degree correction could be underway against 2880.
An interim low is in place around 2300 as prices pullback. Resistance comes around 2500-2600 mark for bears to come back in control. Potential Minute Wave ((iii)) is now progressing lower.
Invalidation point: 2880.
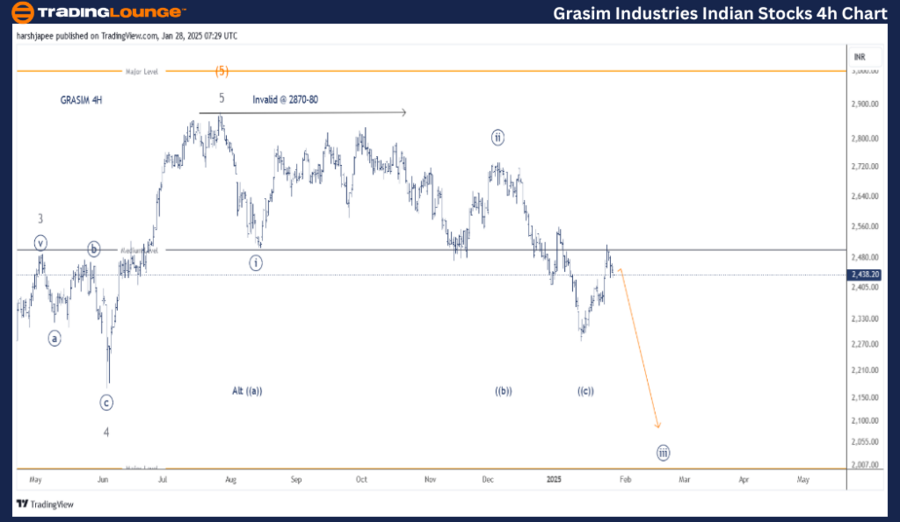
GRASIM four-hour chart technical analysis and potential Elliott Wave counts:
GRASIM 4H chart is highlighting the sub waves since Minor Wave 3 Grey, which terminated around 2487 in May 2024. Minor Wave 4 settled around 2180 in June 2024 unfolding as a sharp zigzag. Wave 5 then rallied through 2880 as an impulse to terminate Intermediate Wave (5) Orange.
The price action thereafter (towards 2275) is in three waves either unfolding as an impulse at Minute degree or an ((a))-((b))-((c)) as marked on the 4H chart here. Bears might be poised to drag lower towards 2175, which is Wave 4 of one lesser degree.
Conclusion:
GRASIM is progressing lower in Minute Wave ((iii)) within an impulse targeting below 2175. Alternatively, a corrective drop could be complete at 2275.
Elliott Wave analyst: Harsh Japee.
GRASIM Elliott Wave technical analysis [Video]
Author

Peter Mathers
TradingLounge
Peter Mathers started actively trading in 1982. He began his career at Hoei and Shoin, a Japanese futures trading company.


