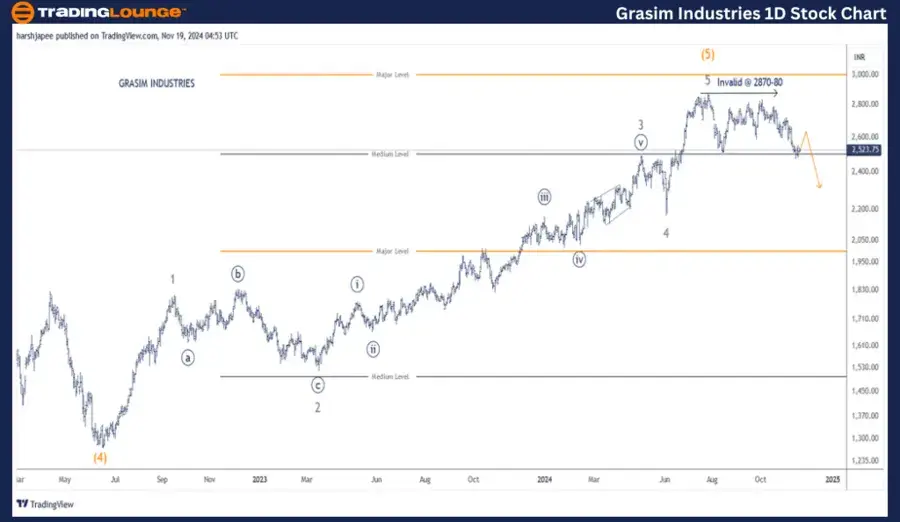
Grasim Industries – Grasim (1D chart) Elliott Wave technical analysis
Function: Counter Trend Lower (Minor Degree Grey).
Mode: Corrective.
Structure: Potential Zigzag.
Position: Still unfolding hence not labelled yet.
Details: A potential Minor degree zigzag could be underway against 2880.
The stock could pull back towards 2600-20 range near term before turning lower again.
Invalidation point: 2880.
GRASIM INDUSTRIES Daily Chart Technical Analysis and potential Elliott Wave Counts:
GRASIM INDUSTRIES daily chart indicates potential termination of its larger degree (Intermediate) uptrend around 2880 mark. The tock might be in its initial stages to mark a larger degree corrective wave as medium term target could be seen towards 2170 levels.
The stock terminated Intermediate Wave (4) around 1270 in June 2022. Since then the rally can be clearly sub divided into five waves Minor 1 through 5, which extended through 2880. If the above is correct, bears are now inclined to carve a larger degree corrective drop towards 2170 at least.
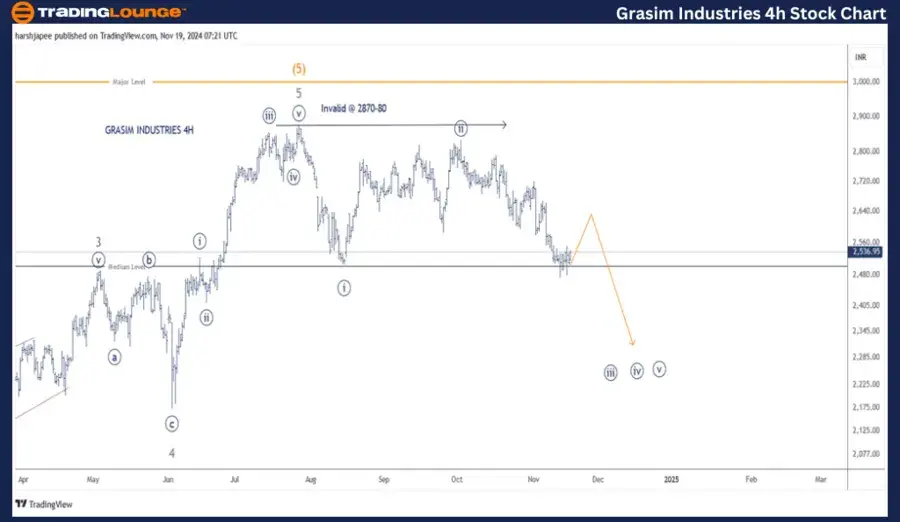
Grasim Industries – Grasim (4H chart) Elliott Wave technical analysis
Function: Counter Trend Lower (Minor Degree Grey).
Mode: Corrective.
Structure: Potential Zigzag.
Position: Minute ((ii)) Grey on 4H chart.
Details: A potential Minor degree zigzag could be underway against 2880. Please note we have labelled Minute Wave ((i)) and ((ii)) potentially complete on 4H chart. If correct, it could be Minor Wave A of the proposed zigzag. The stock could pull back towards 2600-20 range near term before turning lower again.
Invalidation point: 2880.
GRASIM INDUSTRIES 4H Chart Technical Analysis and potential Elliott Wave Counts:
GRASIM INDUSTRIES 4H chart highlights the sub waves since termination of Minor Wave 3 Grey around 2510-20 range. Minor Wave 4 was sharp (Zigzag), followed by an impulse to terminate Minor Wave 5 of (5) around 2880.
Furthermore, Minute Waves ((i)) and ((ii)) might be complete around 2500 and 2835 levels respectively (not yet marked on Daily chart). If correct, Minute ((iii)) could be underway against 2880.
Conclusion:
GRASIM INDUSTRIES might have terminated Intermediate Wave (5) Orange around 2880 and turned lower to carve a similar degree corrective wave.
Elliott Wave Analyst: Harsh Japee.
Grasim Industries – Grasim Elliott Wave technical analysis [Video]
As with any investment opportunity there is a risk of making losses on investments that Trading Lounge expresses opinions on.
Historical results are no guarantee of future returns. Some investments are inherently riskier than others. At worst, you could lose your entire investment. TradingLounge™ uses a range of technical analysis tools, software and basic fundamental analysis as well as economic forecasts aimed at minimizing the potential for loss.
The advice we provide through our TradingLounge™ websites and our TradingLounge™ Membership has been prepared without considering your objectives, financial situation or needs. Reliance on such advice, information or data is at your own risk. The decision to trade and the method of trading is for you alone to decide. This information is of a general nature only, so you should, before acting upon any of the information or advice provided by us, consider the appropriateness of the advice considering your own objectives, financial situation or needs. Therefore, you should consult your financial advisor or accountant to determine whether trading in securities and derivatives products is appropriate for you considering your financial circumstances.
Recommended content
Editors’ Picks

EUR/USD turns positive above 1.0900 as focus shifts to US CPI
EUR/USD erases losses to turn positive above 1.0900 in the European session on Wednesday. The dust settles over the US-EU tariff war as traders shift thier focus toward the key US CPI inflation data due later at 12:30 GMT.

GBP/USD holds losses near 1.2950, US CPI awaited
GBP/USD remans offered near 1.2950 in Wednesday's European session, eroding part of the previous day's strong move up. Global tariff war keep traders on the edge, lifting the havem demand for the US Dollar at the expense of the risk-sensitive Pound Sterling. US CPI data awaited.

Gold price extends the range play as traders await US CPI for Fed rate-cut cues
Gold price struggles to build on the overnight move up, though the downside seems limited. A modest USD bounce from a multi-month low and a positive risk tone cap the precious metal. Trade war fears and Fed rate cut bets support the XAU/USD pair ahead of the US CPI report.

US CPI inflation data set to show inflation cooled slightly in February, keeping Fed in focus
The United States Bureau of Labor Statistics is set to publish the high-impact Consumer Price Index inflation report for February at 12:30 GMT. The CPI figures could notably impact the US Dollar and the Federal Reserve’s cautious monetary policy stance.

Gold price extends the range play as traders await US CPI for Fed rate-cut cues
Gold price struggles to build on the overnight move up, though the downside seems limited. A modest USD bounce from a multi-month low and a positive risk tone cap the precious metal. Trade war fears and Fed rate cut bets support the XAU/USD pair ahead of the US CPI report.

The Best brokers to trade EUR/USD
SPONSORED Discover the top brokers for trading EUR/USD in 2025. Our list features brokers with competitive spreads, fast execution, and powerful platforms. Whether you're a beginner or an expert, find the right partner to navigate the dynamic Forex market.