|premium|

Google (GOOG Stock) testing 38.2% fib support after 8% decline

Google (GOOG) made a bullish breakout above the bull flat pattern as expected in our previous wave analysis. But a bearish pullback is taking place soon after price confirmed a higher high.

Price action is now testing the key support trend line (green) and the Fibonacci support. Let’s review what to expect.

Chart

Price Charts and Technical Analysis

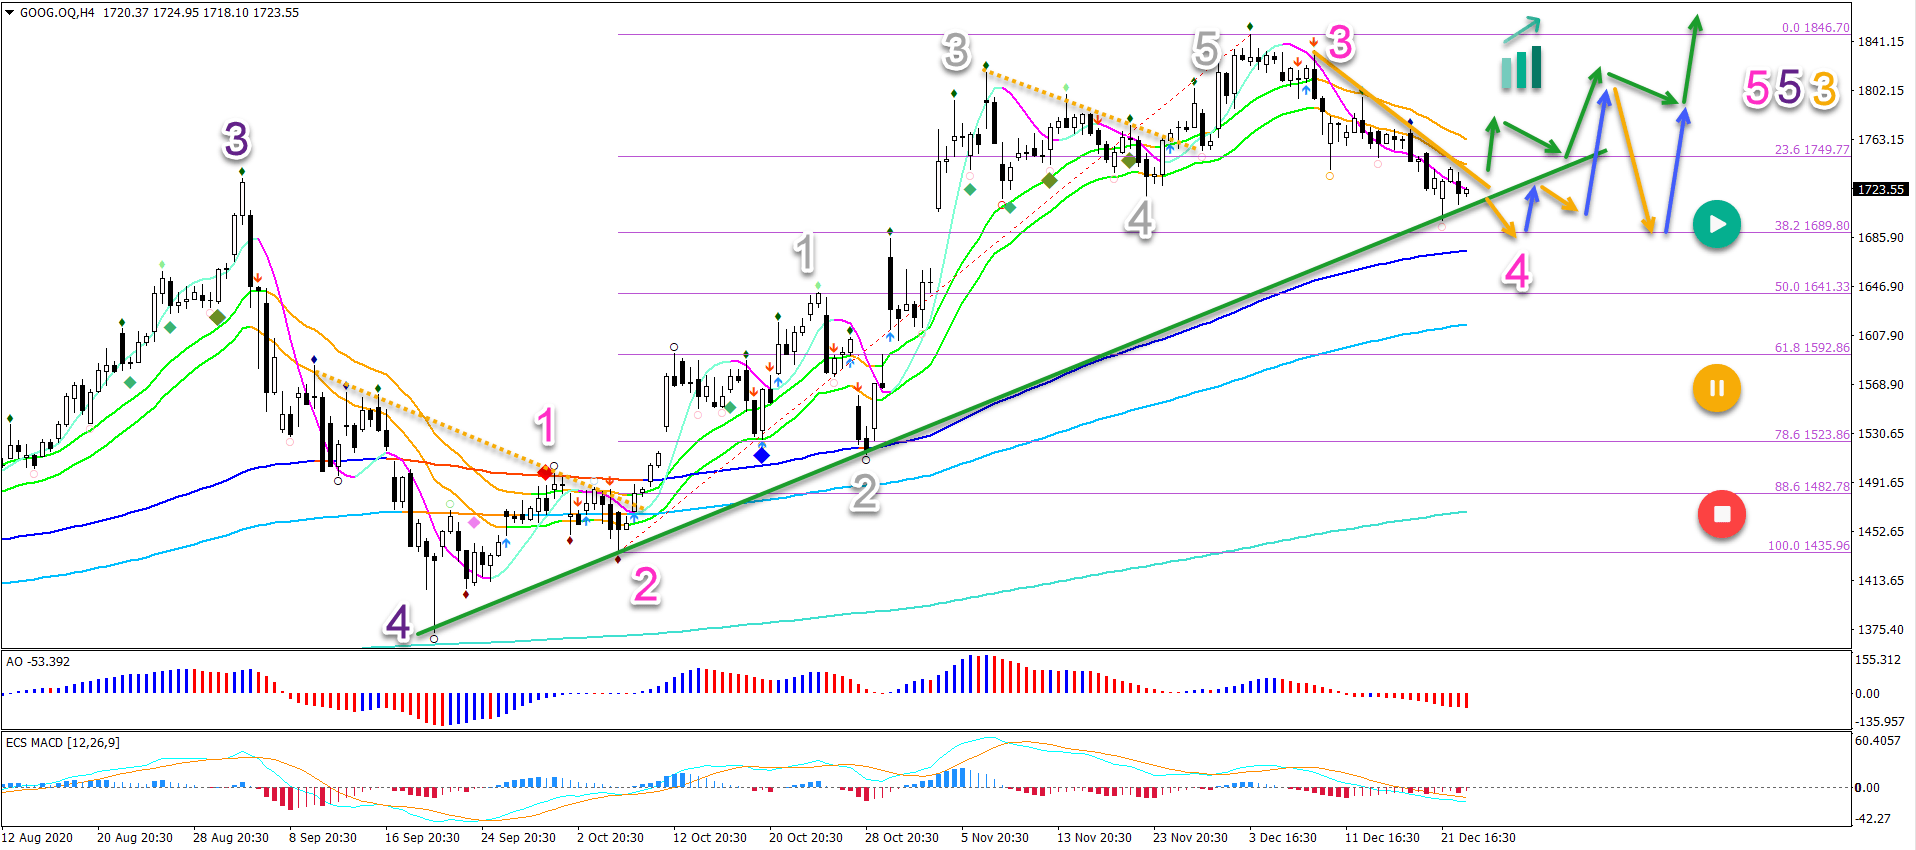
Google seems to be in a wave 4 (pink) pattern. This means that the 38.2% Fibonacci retracement level is a key support zone within the uptrend.

A bullish bounce at the Fib could confirm our view. But a breakout above the resistance trend line (orange) and 21 ema zone is needed to indicate the end of wave 4 and start of wave 5 (pink).

Even a deeper retracement towards the 50-61.8% Fibonacci zone could be part of a wave 4. But a break below the 61.8% Fib certainly places the uptrend on hold (yellow circle) whereas a break below the top of wave 1 invalidates it (red circle).

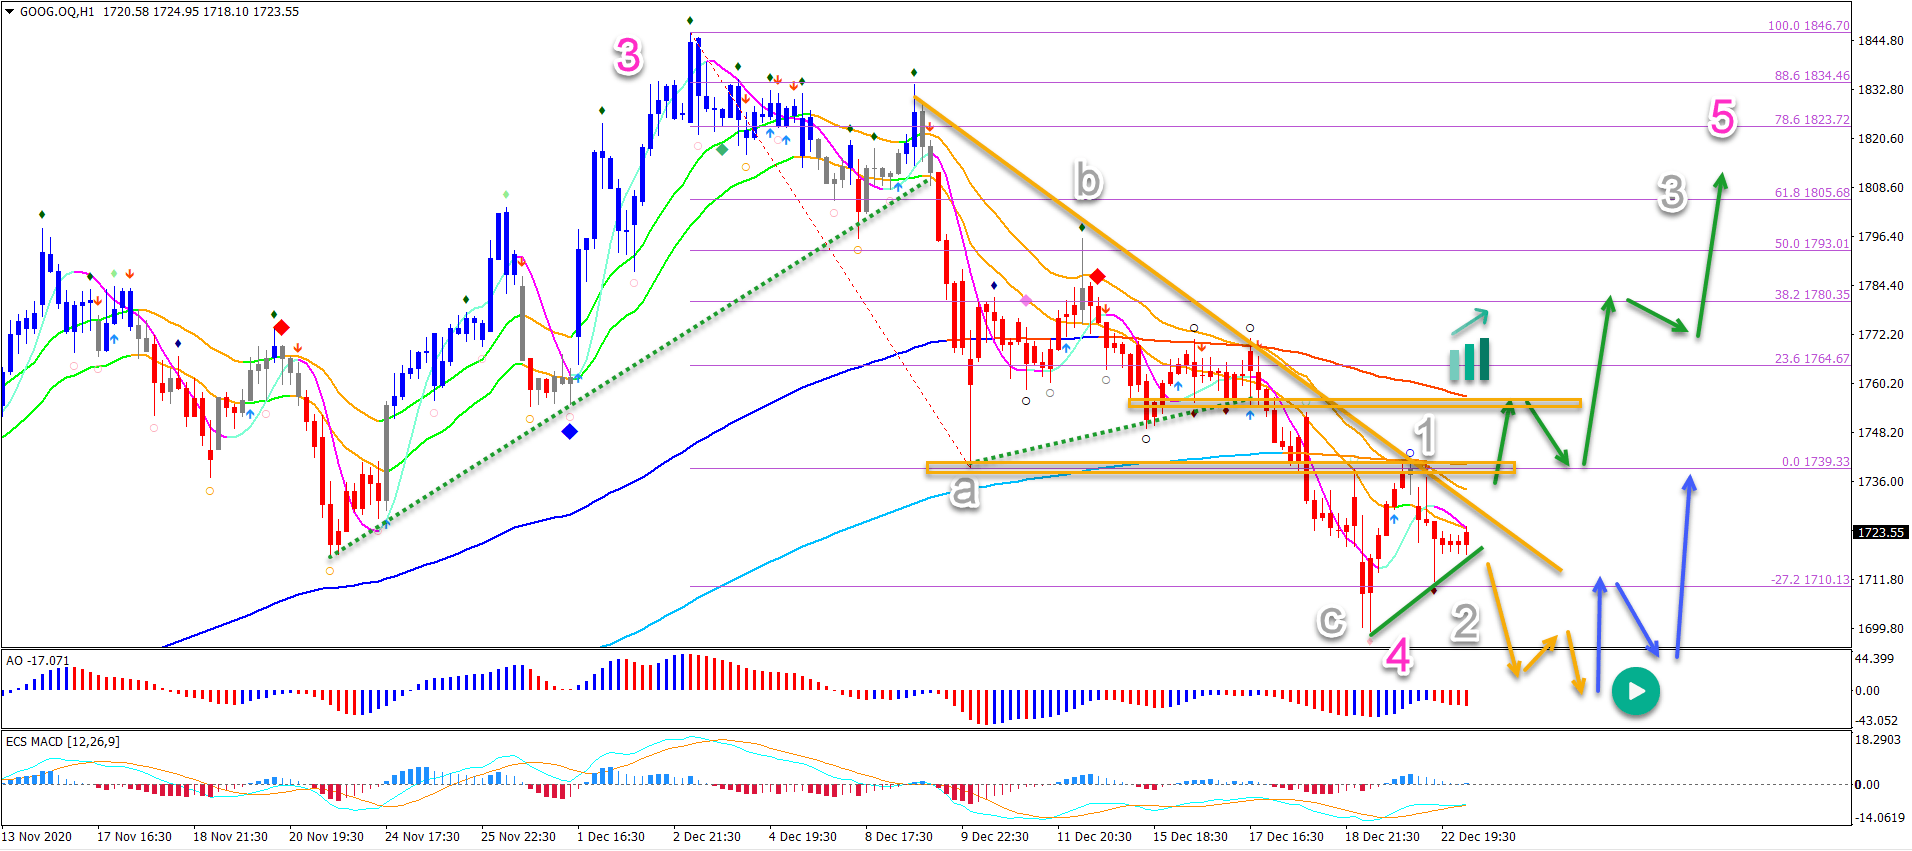
On the 1 hour chart, price action is building an ABC (grey) pattern. Which could complete wave 4 (pink) if price action can break above the local resistance (orange boxes) and long-term moving averages.

A break below the support trend line (green) indicates a push towards the 50% Fibonacci level mentioned on the 4 hour chart.

The bullish targets are first $1,800, followed by the previous top at $1,846 and the -27.2% Fibonacci target at around $1,950.

Chart

The analysis has been done with the ecs.SWAT method and ebook.

Premium

You have reached your limit of 3 free articles for this month.

Start your subscription and get access to all our original articles.

Subscribe to PremiumSign In

Author

Chris Svorcik

Chris Svorcik

Elite CurrenSea

Experience Chris Svorcik has co-founded Elite CurrenSea in 2014 together with Nenad Kerkez, aka Tarantula FX. Chris is a technical analyst, wave analyst, trader, writer, educator, webinar speaker, and seminar speaker of the financial markets.

More from Chris Svorcik
Share:

Editor's Picks

EUR/USD clings to daily gains, still below 1.1900

EUR/USD manages to reverse two daily pullbacks in a row and advances modestly on Thursday, hovering around the 1.1880 zone amid the inconclusive price action around the US Dollar. Meanwhile, weekly Initial Claims rose more than expected last week, while attention is expected to shift to the upcoming US CPI data on Friday.

GBP/USD picks up pace, hits 1.3640

GBP/USD trades with modest gains around 1.3640 so far on Thursday. Indeed, Cable looks to leave behind the weakness seen in the first half of the week in a context of an equally erratic performance in the Greenback and disappoting UK data releases.

Gold stays offered below $5,100

Gold keeps the choppy trade well in place on Thursday, navigating the area below the $5,100 mark per troy ounce amid the lack of clear direction in the Greenback, declining US Treasury yields across the curve and caution ahead of Friday’s publication of US CPI.

LayerZero Price Forecast: ZRO steadies as markets digest Zero blockchain announcement

LayerZero (ZRO) trades above $2.00 at press time on Thursday, holding steady after a 17% rebound the previous day, which aligned with the public announcement of the Zero blockchain and Cathie Wood joining the advisory board. 

A tale of two labour markets: Headline strength masks underlying weakness

Undoubtedly, yesterday’s delayed US January jobs report delivered a strong headline – one that surpassed most estimates. However, optimism quickly faded amid sobering benchmark revisions.

Sonic Labs’ vertical integration fuels recovery in S token

Sonic, previously Fantom (FTM), is extending its recovery trade at $0.048 at the time of writing, after rebounding by over 12% the previous day. The recovery thesis’ strengths lie in the optimism surrounding Sonic Labs’ Wednesday announcement to shift to a vertically integrated model, aimed at boosting S token utility.