Google, CAT and world indices: How to create A forecast within the same cycle
The market is hard to understand and decipher. Many traders use tools like Indicators, Theories, Fundamentals, and Math, among others, to forecast and trade the market. Over the years, we created our system at EWF using Elliott Wave Theory, some Indicators, sequences, cycles, and distribution to create a higher possibility forecast.
The Elliott Wave Theory is subjective. Consequently, a filter will provide better results. The following video explains how we are seeing the World Indices now in the Daily time frame and why we need to be aware first of a cycle possibly ending. We also need to understand the implications that can happen across the Market. Google and most of the Indices, Stocks, and ETFs are trading within a bullish cycle since the lows at 10.2022.
Some stock still need more upside, such as CAT(Caterpillar Inc), which shows five swings since the lows at 10.2022. However, the third swing is the shortest, so more upside should happen. However, Google has the minimum amount of swings as an impulse sequence. Thus, it only calls for an extension within wave V to align with the need for more upside in CAT(Caterpillar Inc). The point is that Google has been sending a warning within the cycle since 10.2022 that it can end. However, we will call an extension within wave V because of CAT.
Neither the Elliott Wave Theory nor any other indicator or fundamental can come up with this forecast because it can not be just one thing. It needs to be a group of tools. We have the system and tools. Our reading is that even if the cycle since 10.2022 is mature in some symbols like Google, it is not over but it soon should be over.
GOOGL and CAT Elliott Wave analysis
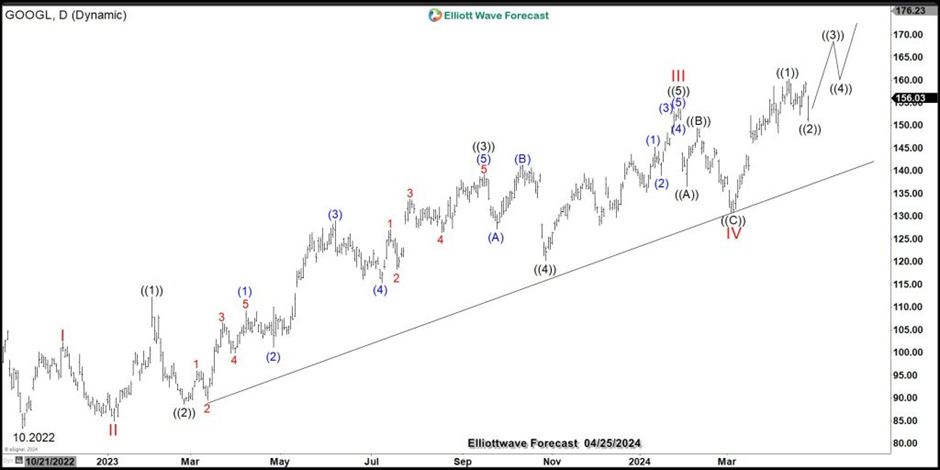
Google (GOOGL) daily Elliott Wave chart
The Google Daily chart shows the five waves have advanced since the lows at 10.2022, which is a warning for the cycle since a precise impulse sequence is in place.
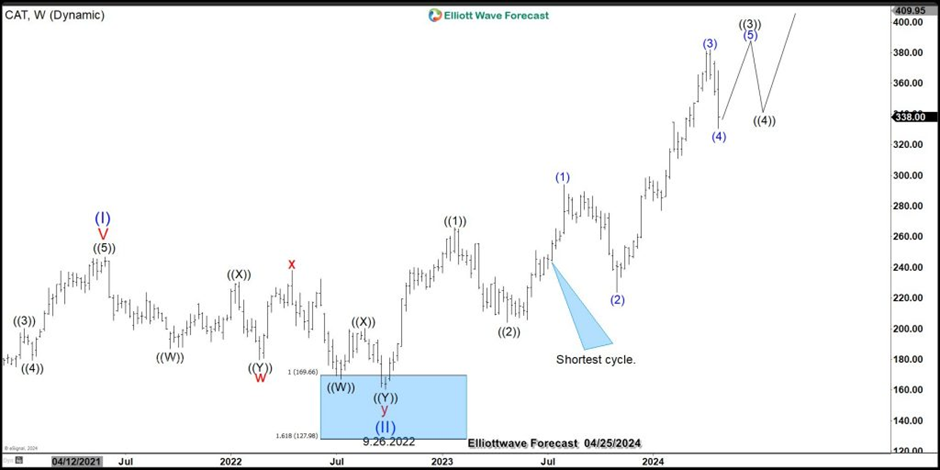
Caterpillar (CAT) Daily Elliott Wave Chart
The CAT Daily chart shows the sequences since 10.2022, in which the third swing is the shortest. This violates the Elliott Wave Theory and can not be used as a complete impulse, so more upside should still follow.
Correlation of Indices and CAT
The following chart shows Google, CAT, SPX, DOW, and Nasdaq, all trading within the cycle since 10.2022.
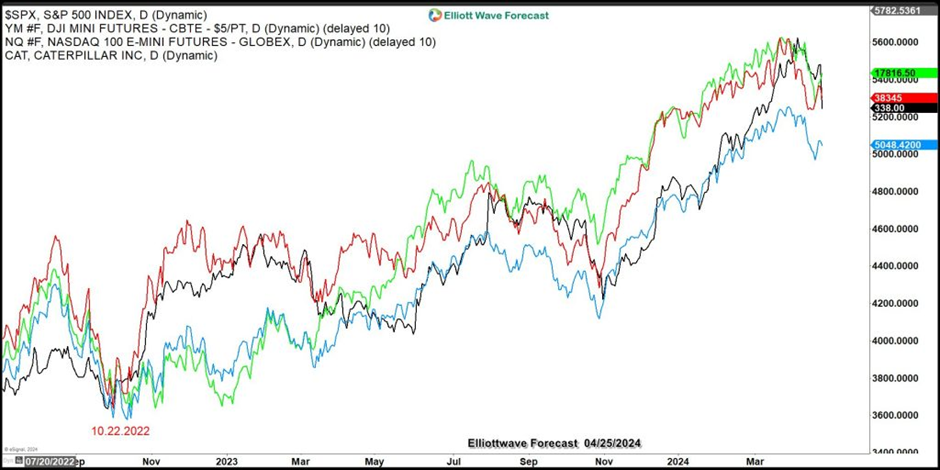
Again, the Market needs to be traded and forecasted with a system, and many instruments must be considered before picking a forecast or a trade.
Author

Elliott Wave Forecast Team
ElliottWave-Forecast.com