|

Gold Technical Analysis: trapped in an expanding falling channel in the hourly chart

Gold is currently trading in a sideways manner within an expanding falling channel, as seen in the chart below.

Hourly chart

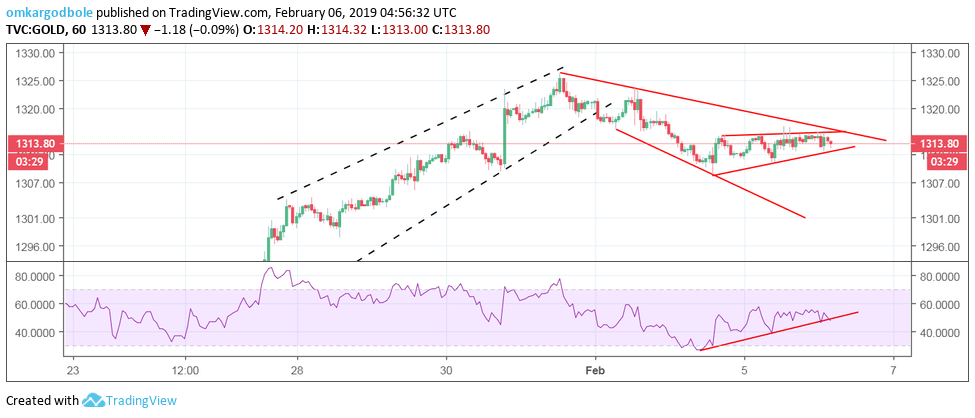
  • The relative strength index (RSI) has dived out of the ascending trendline. So, the metal could take out the lower edge of the minor sideways channel, currently at $1,312.  That would open up downside toward $1,308-$1,305.
  • A break above the falling channel hurdle at $1,316 would imply an end of the corrective pullback and could yield a rally to levels above $1,320.

Trend: bearish below $1,312

XAU/USD

Overview:
    Today Last Price: 1313.5
    Today Daily change: -1.76 pips
    Today Daily change %: -0.13%
    Today Daily Open: 1315.26
Trends:
    Daily SMA20: 1296.91
    Daily SMA50: 1272.58
    Daily SMA100: 1245.75
    Daily SMA200: 1230.24
Levels:
    Previous Daily High: 1316.85
    Previous Daily Low: 1310.1
    Previous Weekly High: 1326.25
    Previous Weekly Low: 1297.8
    Previous Monthly High: 1326.25
    Previous Monthly Low: 1275.9
    Daily Fibonacci 38.2%: 1314.27
    Daily Fibonacci 61.8%: 1312.68
    Daily Pivot Point S1: 1311.29
    Daily Pivot Point S2: 1307.32
    Daily Pivot Point S3: 1304.54
    Daily Pivot Point R1: 1318.04
    Daily Pivot Point R2: 1320.82
    Daily Pivot Point R3: 1324.79

Author

Omkar Godbole

Omkar Godbole

FXStreet Contributor

Omkar Godbole, editor and analyst, joined FXStreet after four years as a research analyst at several Indian brokerage companies.

More from Omkar Godbole
Share:

Editor's Picks

EUR/USD treads water above 1.1850 amid thin trading

EUR/USD stays defensive but holds 1.1850 amid quiet markets in the European hours on Monday.  The US Dollar is struggling for direction due to thin liquidity conditions as US markets are closed in observance of Presidents' Day. 

GBP/USD flat lines as traders await key UK and US macro data

GBP/USD kicks off a new week on a subdued note and oscillates in a narrow range near 1.365 in Monday's European trading. The mixed fundamental backdrop warrants some caution for aggressive traders as the market focus now shifts to this week's important releases from the UK and the US.

Gold slides below $5,000 amid USD uptick and positive risk tone; downside seems limited

Gold attracts fresh sellers at the start of a new week and reverses a part of Friday's strong move up of over $150 from sub-$4,900 levels. The commodity slides back below the $5,000 psychological mark during the Asian session, though the downside potential seems limited amid a combination of supporting factors.

Bitcoin, Ethereum and Ripple consolidate within key ranges as selling pressure eases

Bitcoin and Ethereum prices have been trading sideways within key ranges following the massive correction. Meanwhile, XRP recovers slightly, breaking above the key resistance zone. The top three cryptocurrencies hint at a potential short-term recovery, with momentum indicators showing fading bearish signs.

Global inflation watch: Signs of cooling services inflation

Realized inflation landed close to expectations in January, as negative base effects weighed on the annual rates. Remaining sticky inflation is largely explained by services, while tariff-driven goods inflation remains limited even in the US.

Ripple Price Forecast: XRP potential bottom could be in sight

Ripple edges up above the intraday low of $1.35 at the time of writing on Friday amid mixed price actions across the crypto market. The remittance token failed to hold support at $1.40 the previous day, reflecting risk-off sentiment amid a decline in retail and institutional sentiment.