|

Gold technical analysis: The yellow metal is at the edge of a cliff

  • Gold ends the week on its lows as the market is off the 2019 highs.
  • The level to beat for bears is the 1,485 support level.
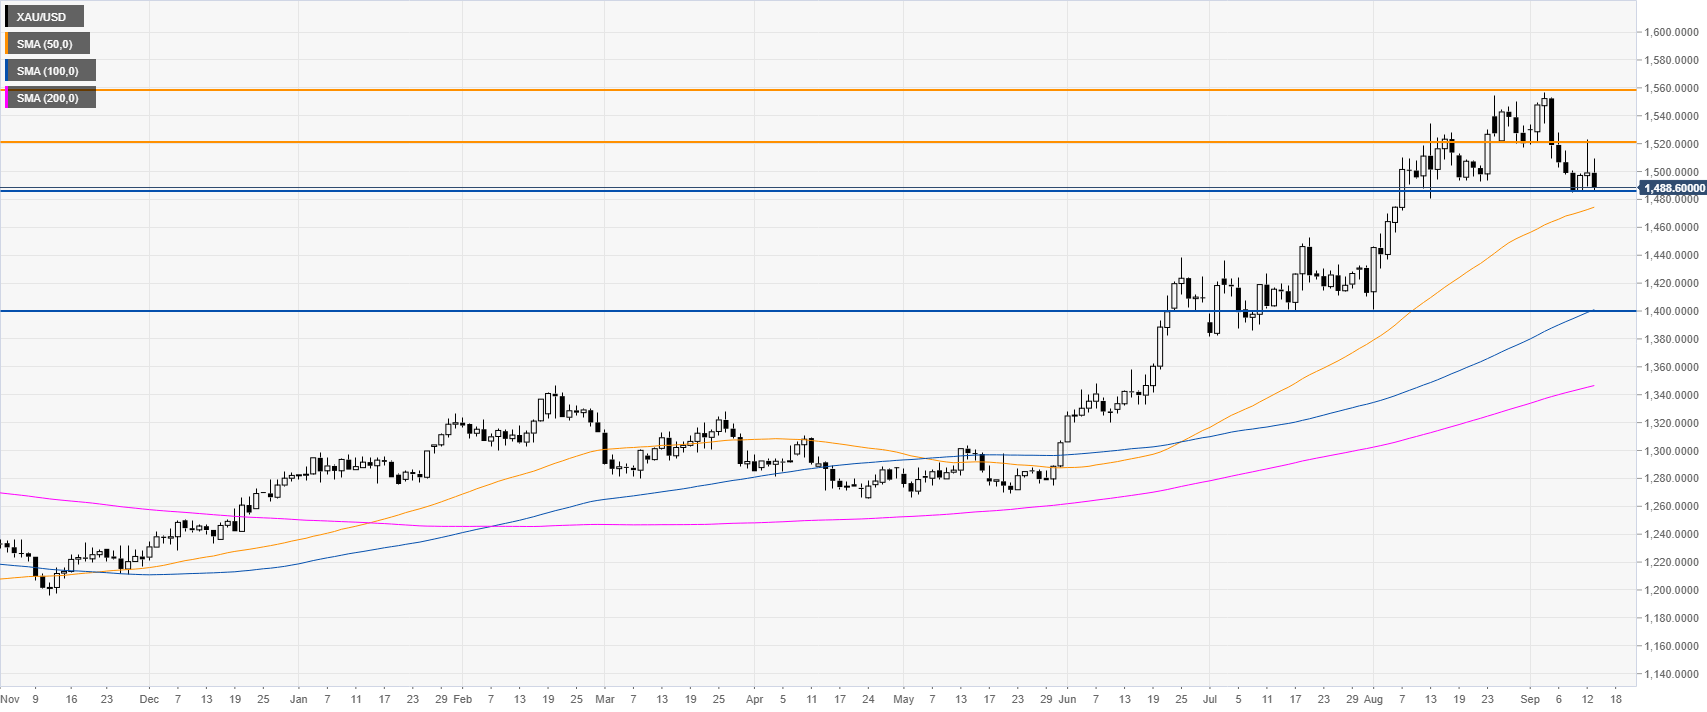
 

Gold daily chart

 
The yellow metal is trading in a bull trend above its main daily simple moving averages (SMAs). The market is challenging the 1,485 support above the 50 SMA. A break below the level can open the doors to a selloff towards the 1,400 figure. 
 
The first level of resistance is likely the 1,520.00 resistance followed by 1,560 near the 2019 high.

Additional key levels

XAU/USD

Overview
Today last price1488.6
Today Daily Change-10.40
Today Daily Change %-0.69
Today daily open1499
 
Trends
Daily SMA201516.89
Daily SMA501472.68
Daily SMA1001398.93
Daily SMA2001345.32
Levels
Previous Daily High1523.3
Previous Daily Low1489.25
Previous Weekly High1557.03
Previous Weekly Low1502.95
Previous Monthly High1554.63
Previous Monthly Low1400.9
Daily Fibonacci 38.2%1510.29
Daily Fibonacci 61.8%1502.26
Daily Pivot Point S11484.4
Daily Pivot Point S21469.8
Daily Pivot Point S31450.35
Daily Pivot Point R11518.45
Daily Pivot Point R21537.9
Daily Pivot Point R31552.5

Author

Flavio Tosti

Flavio Tosti

Independent Analyst


More from Flavio Tosti
Share:

Markets move fast. We move first.

Orange Juice Newsletter brings you expert driven insights - not headlines. Every day on your inbox.

By subscribing you agree to our Terms and conditions.

Editor's Picks

EUR/USD trades with negative bias around 1.1730 amid recovering USD; downside seems limited

The EUR/USD pair kicks off the new week on a softer note, though it remains within striking distance of the highest level since early October, touched last Thursday. Spot prices currently trade around the 1.1730 region, down less than 0.10% for the day.

GBP/USD holds steady above mid-1.3300s as traders await key data and BoE this week

The GBP/USD pair remains on the defensive during the Asian session on Monday, though it lacks bearish conviction and holds above the 200-day Simple Moving Average pivotal support. Spot prices currently trade around the 1.3360 region, nearly unchanged for the day.

Gold retains bullish bias ahead of this week’s key US macro releases

Gold attracts buyers for the fifth straight day and climbs to the $4,330 region during the Asian session on Monday. The commodity remains well within striking distance of its highest level since October 21, touched on Friday, and seems poised to appreciate further amid a supportive fundamental backdrop. 

Solana consolidates as spot ETF inflows near $1 billion signal institutional dip-buying

Solana price hovers above $131 at the time of writing on Monday, nearing the upper boundary of a falling wedge pattern, awaiting a decisive breakout. On the institutional side, demand for spot Solana Exchange-Traded Funds remained firm, pushing total assets under management to nearly $1 billion since launch. 

Big week ends with big doubts

The S&P 500 continued to push higher yesterday as the US 2-year yield wavered around the 3.50% mark following a Federal Reserve (Fed) rate cut earlier this week that was ultimately perceived as not that hawkish after all. The cut is especially boosting the non-tech pockets of the market.

Aave Price Forecast: AAVE primed for breakout as bullish signals strengthen

Aave (AAVE) price is trading above $204 at the time of writing on Friday and approaching the upper boundary of its descending parallel channel; a breakout from this structure would favor the bulls.