Gold Technical Analysis: Rejected at 4H 200MA, hourly RSI diverges in favor of bears

Gold jumped to 4-hour 200-candle moving average (MA) of $1,311 earlier today, as expected, but failed to take out the key hurdle and is currently trading at $1,308.
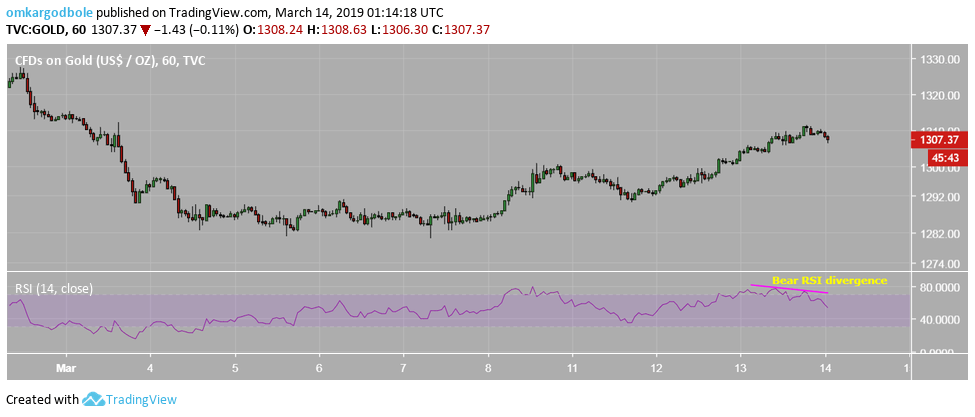
The hourly chart relative strength index (RSI) has rolled over from the overbought territory, creating lower highs in favor of the bears.
Meanwhile, rejection at the 200-candle MA has strengthened the bearish case put forward by the negative crossover of the 100- and 200-candle MAs on the 4H.
The yellow metal, therefore, could see a minor pullback to $1,303-$1,300 levels. A break above the 4H 200-candle MA of $1,311 is needed to revive the bullish view.
4-hour chart
-636881229404221043.png)
Hourly chart
Trend: Pullback likely
Author

Omkar Godbole
FXStreet Contributor
Omkar Godbole, editor and analyst, joined FXStreet after four years as a research analyst at several Indian brokerage companies.


