|

Gold Technical Analysis: Potential pullback to $1,217.70 a troy ounce
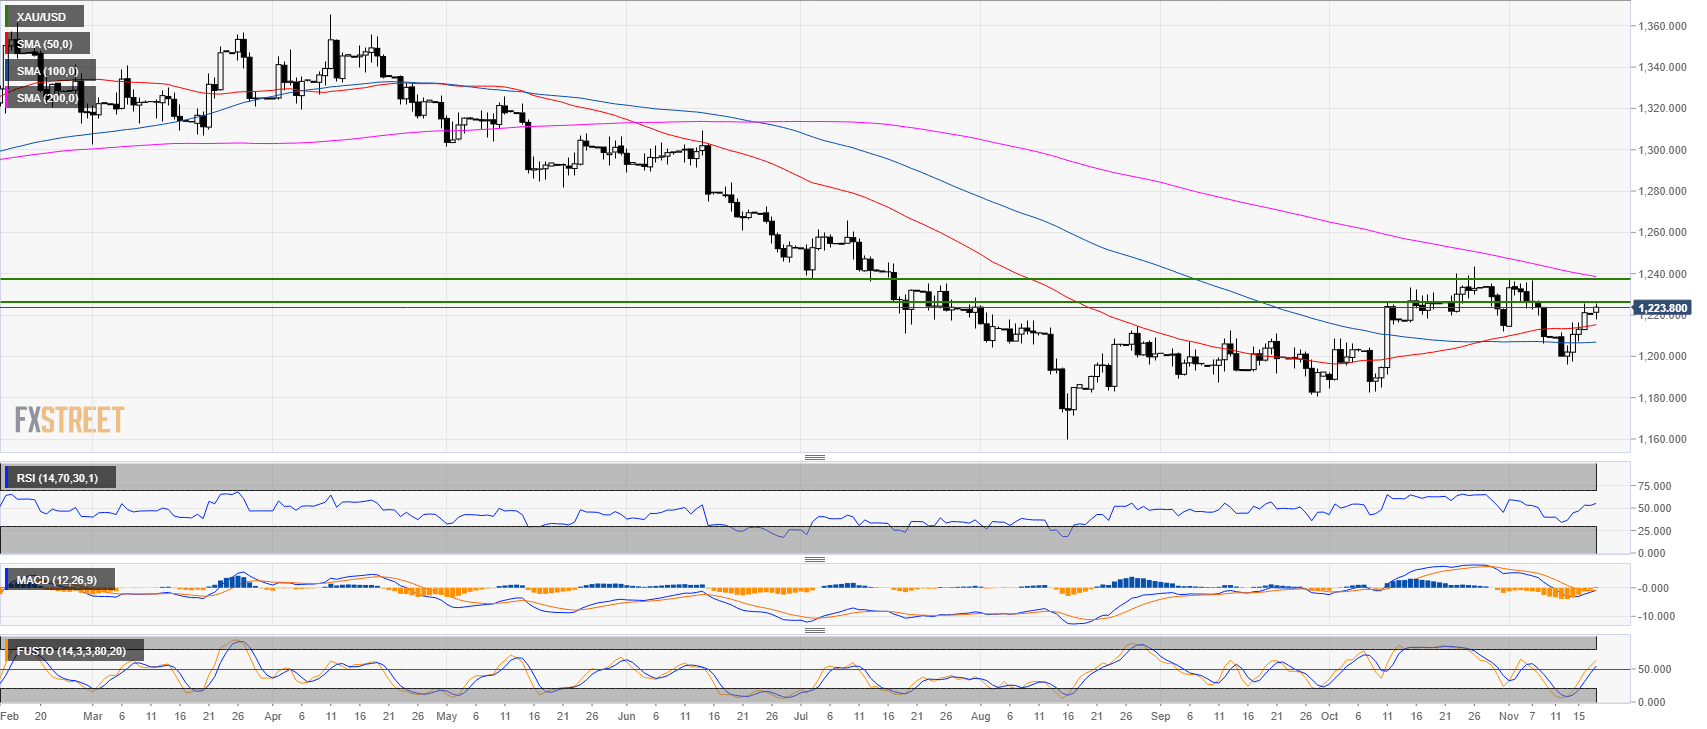
Daily chart

  • Gold is trading in a bear trend below the 200-period simple moving average (SMA). 
  • However, bulls managed to claim the 50 and 100 SMA with the 50 SMA crossing above the 100 SMA.
  • The RSI and Stochastic indicators are trading above the 50 line suggesting bullishness in the market. The MACD is also turning bullish. 
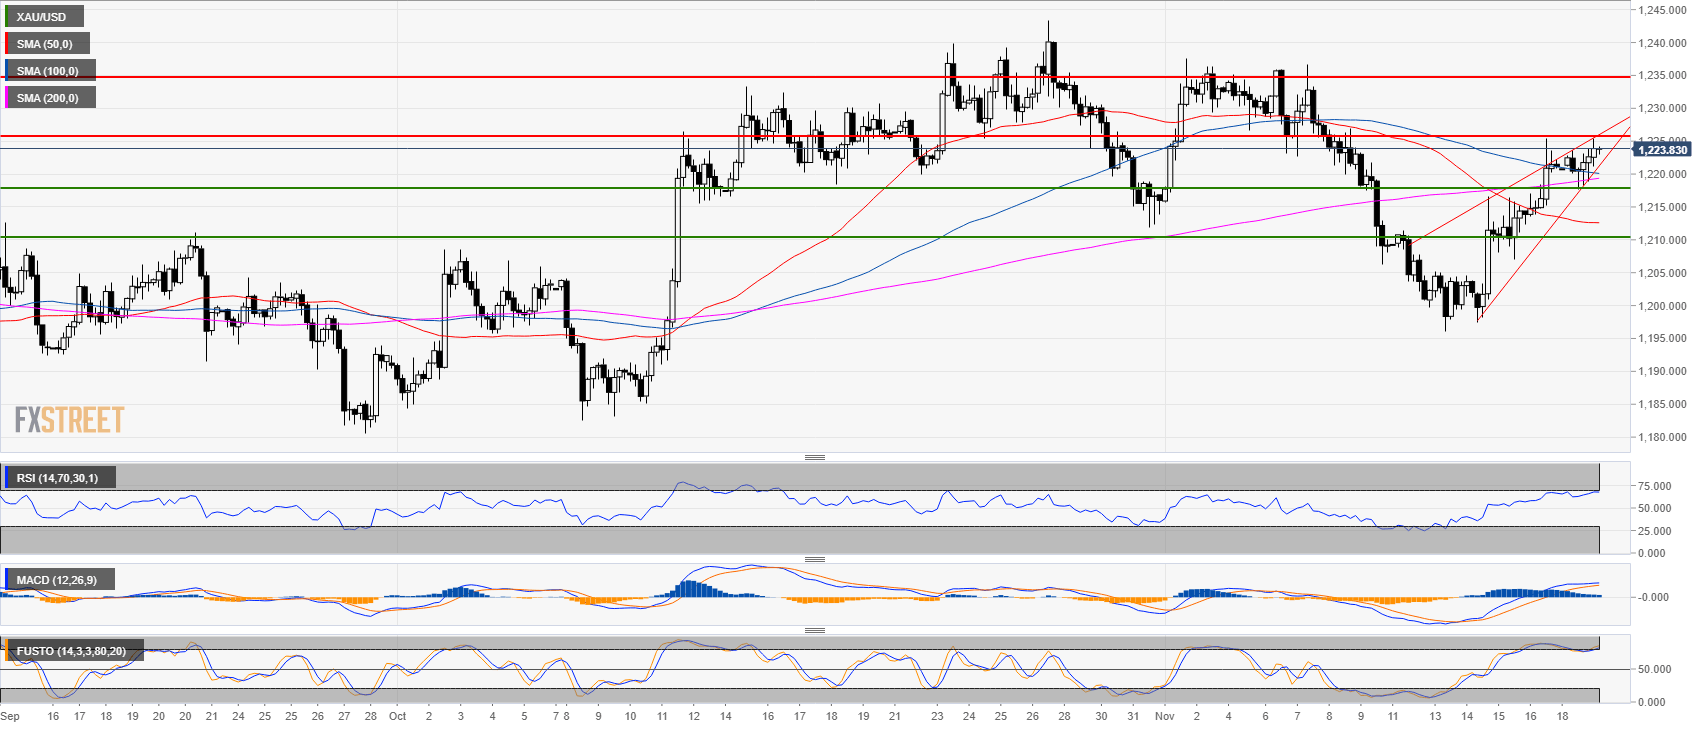

4-hour chart

  • 1,225.40, the current high of the day seems to cap any further advances. 
  • Gold formed a wedge-shaped pattern with potential bearish implications. 
  • A pullback to 1,217.70 seems to be in the cards 
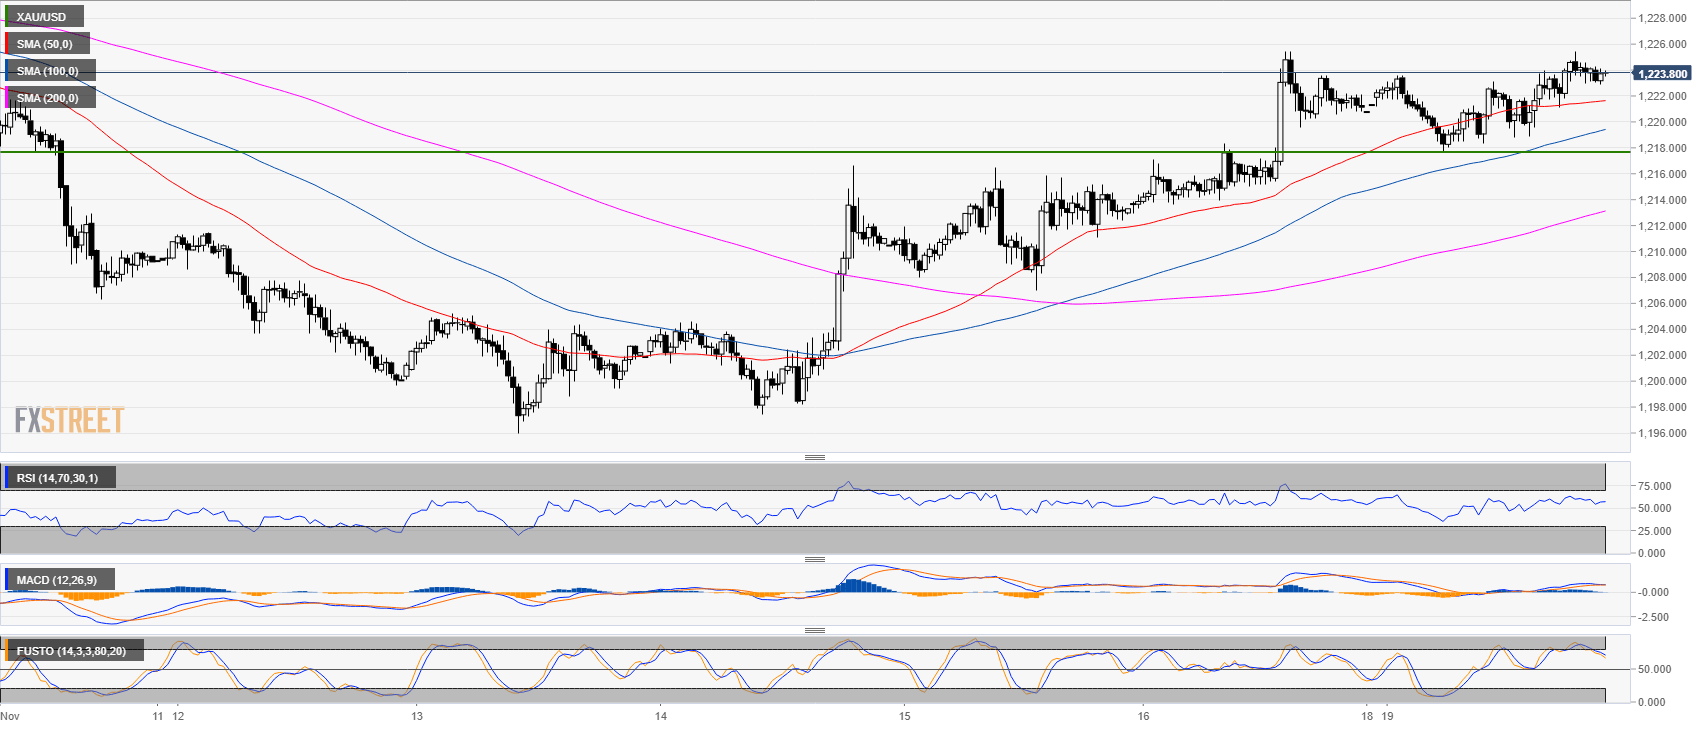
30-minute chart

  • The RSI indicator is still above 50 while the Stochastic is leaving the overbought zone. 
  • The MACD is turning bearish. All suggesting that Gold might have a pullback to 1,217.70 soon.  

Additional key levels at a glance:

XAU/USD

Overview:
    Last Price: 1223.76
    Daily change: 3.0e+2 pips
    Daily change: 0.242%
    Daily Open: 1220.8
Trends:
    Daily SMA20: 1220.15
    Daily SMA50: 1214.77
    Daily SMA100: 1206.74
    Daily SMA200: 1239.09
Levels:
    Daily High: 1220.8
    Daily Low: 1220.8
    Weekly High: 1225.4
    Weekly Low: 1196
    Monthly High: 1243.43
    Monthly Low: 1182.54
    Daily Fibonacci 38.2%: 1220.8
    Daily Fibonacci 61.8%: 1220.8
    Daily Pivot Point S1: 1220.8
    Daily Pivot Point S2: 1220.8
    Daily Pivot Point S3: 1220.8
    Daily Pivot Point R1: 1220.8
    Daily Pivot Point R2: 1220.8
    Daily Pivot Point R3: 1220.8

Author

Flavio Tosti

Flavio Tosti

Independent Analyst


More from Flavio Tosti
Share:

Markets move fast. We move first.

Orange Juice Newsletter brings you expert driven insights - not headlines. Every day on your inbox.

By subscribing you agree to our Terms and conditions.

Editor's Picks

EUR/USD stays defensive below 1.1750 as USD finds its feet

EUR/USD kicks off the new week on a softer note, holding below 1.1750 in European trading on Monday. The pair faces challenges due to a pause in the US Dollar downtrend, with traders shifting their focus to the delayed US Nonfarm Payrolls and CPI data for fresh directives. The ECB policy decision is also eagerly awaited. 

GBP/USD holds steady above 1.3350 as traders await key data and BoE

GBP/USD remains on the back foot above 1.3350 in the European session on Monday, though it lacks bearish conviction and holds above the key 200-day SMA support. The US Dollar holds its recovery mode ahead of key data releases, while the Pound Sterling faces headwinds from the expected BoE rate cut this week. 

Gold climbs to seven-week highs on Fed rate cut bets, safe-haven demand

Gold price rises to seven-week highs to near $4,350 during the early European trading hours on Monday. The precious metal extends its upside amid the prospect of interest rate cuts by the US Fed next year. Lower interest rates could reduce the opportunity cost of holding Gold, supporting the non-yielding precious metal.

Solana consolidates as spot ETF inflows near $1 billion signal institutional dip-buying

Solana price hovers above $131 at the time of writing on Monday, nearing the upper boundary of a falling wedge pattern, awaiting a decisive breakout. On the institutional side, demand for spot Solana Exchange-Traded Funds remained firm, pushing total assets under management to nearly $1 billion since launch. 

Big week ends with big doubts

The S&P 500 continued to push higher yesterday as the US 2-year yield wavered around the 3.50% mark following a Federal Reserve (Fed) rate cut earlier this week that was ultimately perceived as not that hawkish after all. The cut is especially boosting the non-tech pockets of the market.

Solana Price Forecast: SOL consolidates as spot ETF inflows near $1 billion signal institutional dip-buying

Solana (SOL) price hovers above $131 at the time of writing on Monday, nearing the upper boundary of a falling wedge pattern, awaiting a decisive breakout.