Gold rises as markets eye lower interest rates, central-bank demand
- Gold price rises as markets increase their bets of interest rates coming down in the US.
- Central bank buying of Gold remains strong in March, according to the World Gold Council.
- The Chinese Caixin services PMI data remains in expansive territory, supporting the outlook for a key market for Gold.

The Gold price (XAU/USD) is trading up by almost a percent, in the $2,320s on Monday, as markets weigh the implications of weaker-than-expected US jobs data on interest rates – a key driver of Gold price – and economic data from China, a major market for Gold, stays in expansive territory. Central bank demand remains strong further supporting prices.
Gold price rises after US jobs, China data
Gold price rebounds on Monday as markets mull the outlook for interest rates in the light of recent US employment metrics.
Friday’s US Nonfarm Payrolls data from the Bureau of Labor Statistics showed a below-estimated 175K people found work in April. More importantly, wage inflation showed a slowdown, with Average Hourly Earnings both on a yearly and monthly basis ticking down from where economists had expected.
The weaker-than-expected data suggests the Federal Reserve (Fed) may lower interest rates sooner than had been anticipated. This scenario increases the attractiveness of Gold as lower interest rates reduce the opportunity cost of owning the non-yielding precious metal.
Chinese Caixin Services PMI data released Monday showed the sector remaining in expansive territory (above 50) in April, keeping alive hopes of buoyant demand for Gold in China despite the country’s recent economic woes.
Central Bank acquisitions of Gold remain net positive
According to data from the World Gold Council (WGC) tracking central bank acquisitions of Gold in March, buying showed a net positive of 15 tonnes from central banks, who have become one of the largest consumers of Gold in recent years.
The figure was in line with previous months, keeping the positive trend in demand alive.
“Buying strength has continued into 2024, with emerging market banks the main driving force for both purchases and sales,” said Krishan Gopaul Senior Analyst, EMEA
at the World Gold Council.
Technical Analysis: Gold price starts oscillating in a range
Gold price (XAU/USD) has started trading sideways on the 4-hour chart, which is used to analyze the short-term trend.
The pair has just retested the ceiling of a mini-range at around $2,326, and has pulled back during the last period. This is also the level of the 50 Simple Moving Average (SMA), painted in red in the chart below.
XAU/USD 4-hour Chart
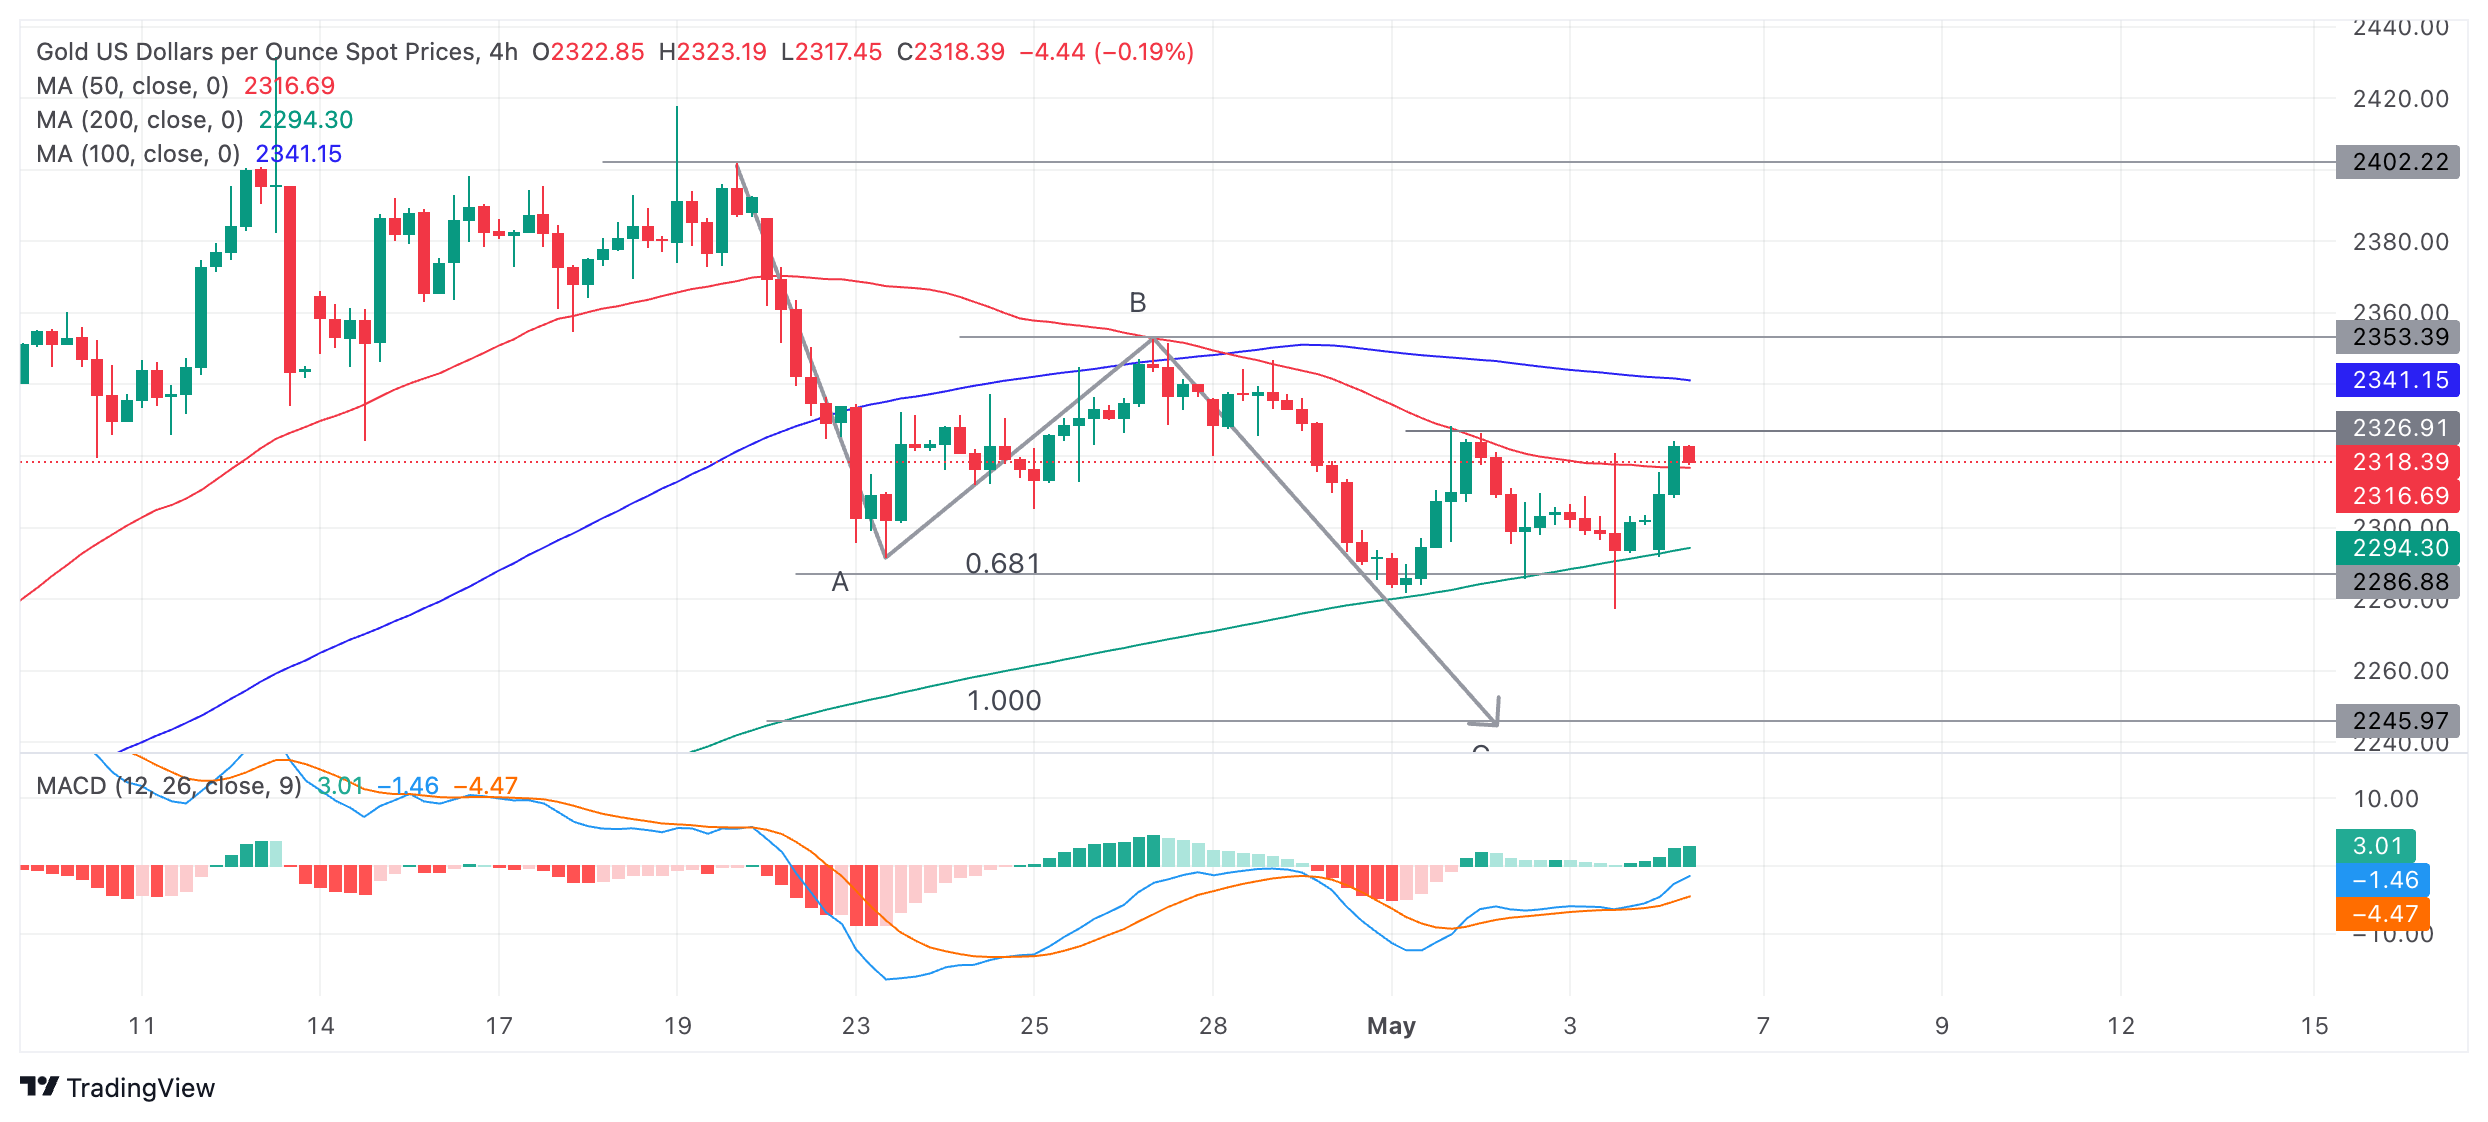
Price could potentially pull back further and fall to the base of the range at around $2,280 or break out of the top of the range and start moving towards resistance at $2,353, which aligns with the top of the late April swing high and top of wave B.
A decisive break out of the top of the range would signal a likely move up to a conservative target at $2,353, (top of wave B) and the 0.681 Fibonacci extension of the height of the range extrapolated higher. In a bullish case, it could even possibly make it to $2,370.
A decisive break would be one characterized by a longer-than-average green candlestick that pierces above the range ceiling, and closes near its high; or three green candlesticks in a row that pierce above the respective level.
Unfinished Measured Move
Gold price is potentially unfolding a bearish Measured Move price pattern which began on April 19.
Measured Moves are zig-zag type patterns composed of three waves labeled A, B and C, with C usually equalling A or a Fibonnaci 0.681 of A. Price has fallen to the conservative estimate for wave C at $2,286, the Fibonacci 0.681 of wave A.
Wave C could still go lower and reach the 100% extrapolation of A at $2,245 (1.000 or where A=C). Such a move would be confirmed by a decisive break below the range and the May 3 low at $2,277.
The trend for Gold price is up on both the medium and long-term charts (daily and weekly), overall supporting the outlook on lower time frames.
Gold FAQs
Gold has played a key role in human’s history as it has been widely used as a store of value and medium of exchange. Currently, apart from its shine and usage for jewelry, the precious metal is widely seen as a safe-haven asset, meaning that it is considered a good investment during turbulent times. Gold is also widely seen as a hedge against inflation and against depreciating currencies as it doesn’t rely on any specific issuer or government.
Central banks are the biggest Gold holders. In their aim to support their currencies in turbulent times, central banks tend to diversify their reserves and buy Gold to improve the perceived strength of the economy and the currency. High Gold reserves can be a source of trust for a country’s solvency. Central banks added 1,136 tonnes of Gold worth around $70 billion to their reserves in 2022, according to data from the World Gold Council. This is the highest yearly purchase since records began. Central banks from emerging economies such as China, India and Turkey are quickly increasing their Gold reserves.
Gold has an inverse correlation with the US Dollar and US Treasuries, which are both major reserve and safe-haven assets. When the Dollar depreciates, Gold tends to rise, enabling investors and central banks to diversify their assets in turbulent times. Gold is also inversely correlated with risk assets. A rally in the stock market tends to weaken Gold price, while sell-offs in riskier markets tend to favor the precious metal.
The price can move due to a wide range of factors. Geopolitical instability or fears of a deep recession can quickly make Gold price escalate due to its safe-haven status. As a yield-less asset, Gold tends to rise with lower interest rates, while higher cost of money usually weighs down on the yellow metal. Still, most moves depend on how the US Dollar (USD) behaves as the asset is priced in dollars (XAU/USD). A strong Dollar tends to keep the price of Gold controlled, whereas a weaker Dollar is likely to push Gold prices up.
Author

Joaquin Monfort
FXStreet
Joaquin Monfort is a financial writer and analyst with over 10 years experience writing about financial markets and alt data. He holds a degree in Anthropology from London University and a Diploma in Technical analysis.


