Gold recovers after sell-off on increased safe-haven demand
- Gold has cushioned its decline as investors seek it out for its safe-haven qualities on Friday.
- Mounting geopolitical risks from multiple hotspots – China, Gaza and Ukraine – are sending investors fleeing for safety.
- Stronger-than-expected US data on Thursday sent Gold into a downward spiral as higher interest rates become normalized.

Gold (XAU/USD) puts in a temporary floor under the recent sell-off on Friday, trading a quarter of a percent higher at around the $2,340s, as a combination of market and geopolitical concerns lead investors to seek solace in its safe-haven qualities.
Gold retrenches on geopolitical concerns
The news that China has started a second day of war games around Taiwan, as well as the decision by Ireland, Norway and Spain to recognise the independent state of Palestine, have ratcheted up geopolitical tensions and impacted markets, helping drive demand for Gold.
Asian stocks are broadly lower on Friday, with the Hang Seng down 1.71%, the Shanghai Composite down 0.90%, and the Nikkie closing 1.36% lower. Investor concerns about high interest rates were a further factor weighing on sentiment.
Gold price weakened after US data
A slew of unexpectedly strong US economic data took its toll on the price of Gold on Thursday.
The higher-than-expected US Purchasing Manager Index (PMI) preliminary data for May, especially in the Services sector – which has been singled out as a major contributor to high inflation – has dialed back bets that the Federal Reserve (Fed) will implement early interest-rate cuts. This is negative for non-yielding Gold as it increases the opportunity cost of holding the precious metal.
India imports fall
The relatively high price of Gold may also be acting as a counterweight to demand in India, according to Reuters, who notes a fall in imports to the country as “high prices encourage retail customers to exchange old jewelry for new products”, reports FXStreet Editor Lallalit Srijandorn.
Technical Analysis: Gold breaks below major trendline
Gold price (XAU/USD) has decisively broken below a major trendline for the uptrend since February, ushering in a new more bearish technical atmosphere.
The steep decline from the all-time highs registered on Monday now suggests Gold is probably in a short-term downtrend, favoring short positions over longs.
XAU/USD 4-hour Chart
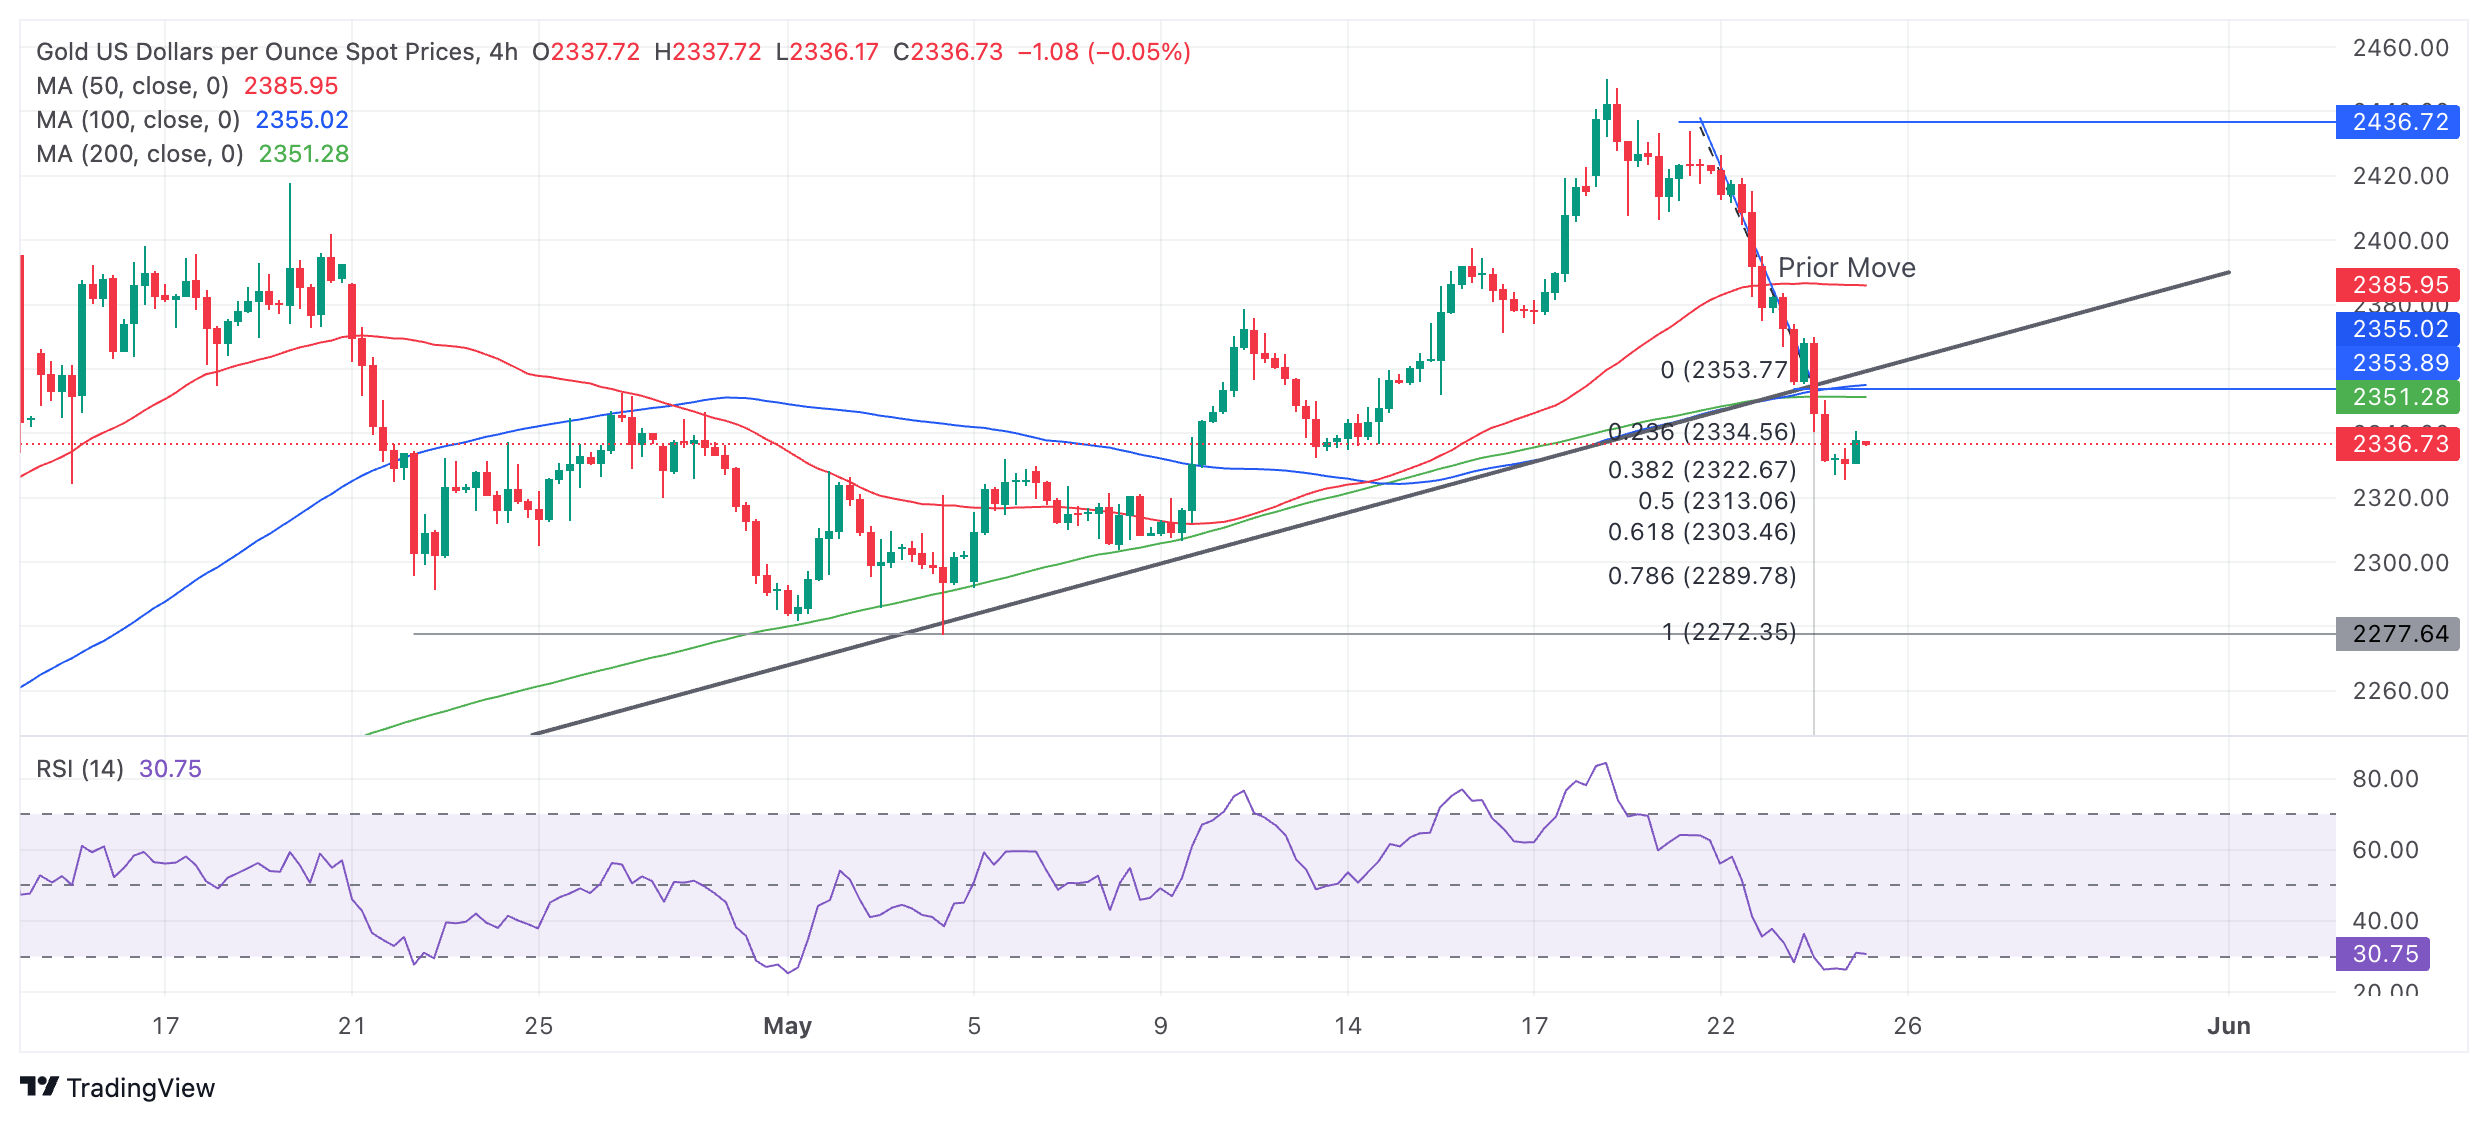
The penetration of the major trendline signals Gold will probably now fall to a conservative target at $2,303 (Fibonacci 0.618 extrapolation of the prior down move from $2,435 to $2,355) or all the way down to $2,272 (100% of the prior down move). The latter level is also the support from the May 3 lower high. A break below the $2,325 lows would provide confirmation of more downside to these targets.
The Relative Strength Index (RSI) became oversold and then reentered neutral territory on the previous bar, suggesting an increased chance of a pull back. It is also possible Gold could correct higher and return to the trendline in a throwback move before rolling over and going lower.
The precious metal’s medium and long-term trends are still bullish, suggesting the risk of a recovery remains high, yet price action does not suggest this is currently the case.
A decisive break back above the trendline at $2,360 would provide evidence of a recovery and reversal of the short-term downtrend.
A decisive break would be one accompanied by a long green bullish candle or three green candles in a row.
Economic Indicator
S&P Global Services PMI
The S&P Global Services Purchasing Managers Index (PMI), released on a monthly basis, is a leading indicator gauging business activity in the US services sector. As the services sector dominates a large part of the economy, the Services PMI is an important indicator gauging the state of overall economic conditions. The data is derived from surveys of senior executives at private-sector companies from the services sector. Survey responses reflect the change, if any, in the current month compared to the previous month and can anticipate changing trends in official data series such as Gross Domestic Product (GDP), industrial production, employment and inflation. A reading above 50 indicates that the services economy is generally expanding, a bullish sign for the US Dollar (USD). Meanwhile, a reading below 50 signals that activity among service providers is generally declining, which is seen as bearish for USD.
Read more.Last release: Thu May 23, 2024 13:45 (Prel)
Frequency: Monthly
Actual: 54.8
Consensus: 51.3
Previous: 51.3
Source: S&P Global
Author

Joaquin Monfort
FXStreet
Joaquin Monfort is a financial writer and analyst with over 10 years experience writing about financial markets and alt data. He holds a degree in Anthropology from London University and a Diploma in Technical analysis.


