Gold price edges up above $2,400 amid firm US yields
- Gold price climbs above $2,400, ending a four-day losing streak amid falling US Treasury yields.
- Traders await crucial economic data, including June’s inflation and Q2 GDP, to gauge the Fed’s next move.
- India’s import tax cut on gold and silver boosts retail demand, supporting bullion prices.

Gold price recovered in the mid-North American session, boosted by a drop in US Treasury bond yields. This pushed the Greenback lower amid a busy Us economic docket in the week, which will feature crucial data. The XAU/USD trades at $2,404, up by 0.33%.
Wall Street trades with gains for the second straight day as market players digest last weekend's political developments in the US. Market players are eyeing the release of June’s inflation data and the preliminary reading of the Gross Domestic Product (GDP) for the second quarter of 2024.
The non-yielding metals are ending a four-day streak of losses as market participants await the Fed's first interest rate cut, according to a Reuters poll. The survey showed that 73 of 100 economists expect Powell and Co. to ease policy by 50 basis points (bps) in 2024, with 13 expecting 25 bps and three expecting no cuts.
Traders speculate the first 25 bps rate cut will be in September, as shown by the CME FedWatch Tool, with odds at 96%.
In the meantime, the US 10-year Treasury bond yield falls one and a half bps to 4.24%, a tailwind for the precious metal.
The Core Personal Consumption Expenditures (PCE) Price Index could be the last piece of the puzzle for Fed officials to begin relaxing policy. Sources cited by Reuters commented, “Anything weaker than expected (PCE data) would be a positive, mainly because it would convince the markets that the U.S. central bank is easing monetary policy in September.”
Bullion was also boosted by India’s slashing import taxes on Gold and Silver, which could lift retail demand.
The US Dollar Index (DXY), which tracks the currency's performance against six other currencies, aims up 0.17% at 104.45. This kept Gold prices glued to the $2,400 mark despite posting gains.
Daily digest market movers: Gold price recovers the $2,400 figure
- Gold traders are focused on the release of key economic data, including Durable Goods Orders, the preliminary Q2 GDP number, and the Core PCE for June.
- Durable Goods Orders are expected to increase from 0.1% to 0.4% month-over-month (MoM).
- The Gross Domestic Product (GDP) for Q2 is projected to rise from 1.4% in Q1 2024 to 1.9% quarter-over-quarter (QoQ), indicating that the economy is accelerating as the year progresses.
- The Fed’s preferred measure of inflation, the Core PCE, is expected to dip from 2.6% to 2.5% year-over-year (YoY).
- The latest Consumer Price Index (CPI) data revealed a continuation of the disinflation process in the United States (US), boosting gold prices and increasing the likelihood that the Fed will cut interest rates starting in September.
- December 2024 fed funds rate futures contract implies that the Fed will ease policy by 50 basis points (bps) toward the end of the year, up from 48 a day ago.
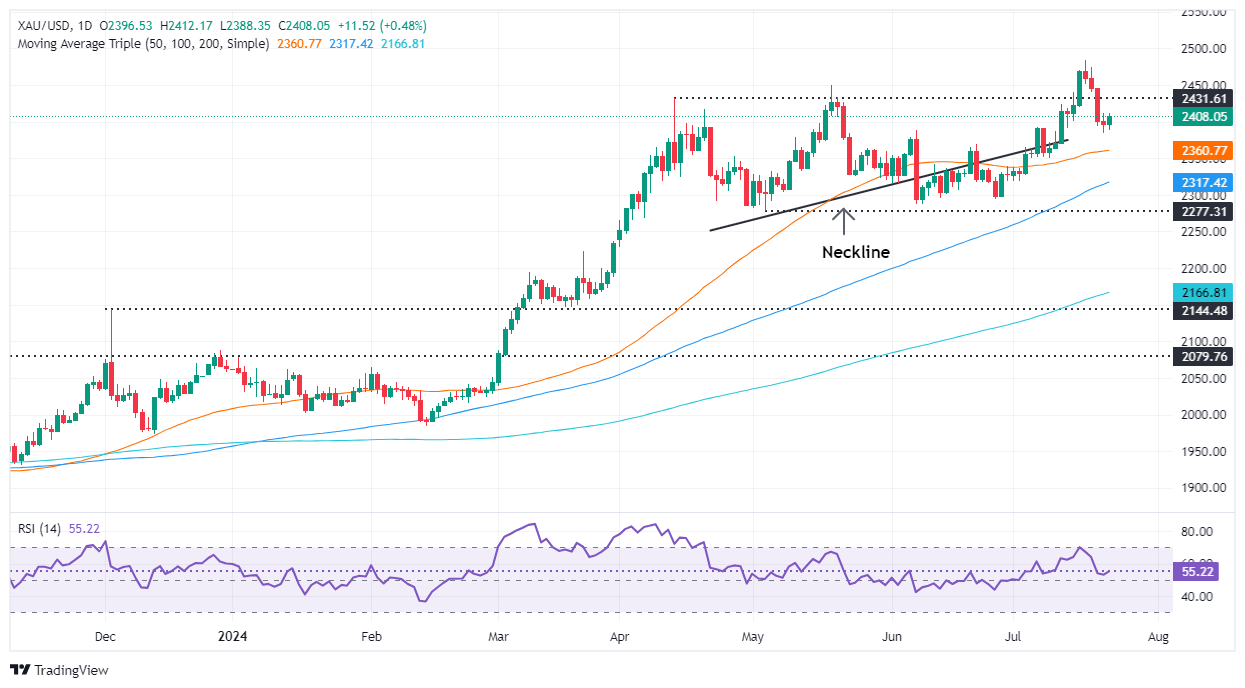
Technical analysis: Gold price contained within Monday’s trading range
Gold price seems to have finished its losing streak, forming a ‘bullish harami,’ a two-candle pattern, hinting the uptrend could continue in the near term.
The Relative Strength Index (RSI) is bullish and indicates that buyers are gathering momentum, which could drive prices higher.
XAU/USD needs to clear Monday’s high at $2,412 for a bullish continuation. Once surpassed, the next resistance would be $2,450 before challenging the all-time high of $2,483. Up next would be the $2,500 figure.
Conversely, if XAU/USD tumbles below the July 22 low of $2,384, a deeper correction is on the cards. The next support would be the 50-day Simple Moving Average (SMA) at $2,359. Once sellers clear the 100-day SMA at $2,315, further losses are seen before falling toward $2,300.
Gold FAQs
Gold has played a key role in human’s history as it has been widely used as a store of value and medium of exchange. Currently, apart from its shine and usage for jewelry, the precious metal is widely seen as a safe-haven asset, meaning that it is considered a good investment during turbulent times. Gold is also widely seen as a hedge against inflation and against depreciating currencies as it doesn’t rely on any specific issuer or government.
Central banks are the biggest Gold holders. In their aim to support their currencies in turbulent times, central banks tend to diversify their reserves and buy Gold to improve the perceived strength of the economy and the currency. High Gold reserves can be a source of trust for a country’s solvency. Central banks added 1,136 tonnes of Gold worth around $70 billion to their reserves in 2022, according to data from the World Gold Council. This is the highest yearly purchase since records began. Central banks from emerging economies such as China, India and Turkey are quickly increasing their Gold reserves.
Gold has an inverse correlation with the US Dollar and US Treasuries, which are both major reserve and safe-haven assets. When the Dollar depreciates, Gold tends to rise, enabling investors and central banks to diversify their assets in turbulent times. Gold is also inversely correlated with risk assets. A rally in the stock market tends to weaken Gold price, while sell-offs in riskier markets tend to favor the precious metal.
The price can move due to a wide range of factors. Geopolitical instability or fears of a deep recession can quickly make Gold price escalate due to its safe-haven status. As a yield-less asset, Gold tends to rise with lower interest rates, while higher cost of money usually weighs down on the yellow metal. Still, most moves depend on how the US Dollar (USD) behaves as the asset is priced in dollars (XAU/USD). A strong Dollar tends to keep the price of Gold controlled, whereas a weaker Dollar is likely to push Gold prices up.
Author

Christian Borjon Valencia
FXStreet
Markets analyst, news editor, and trading instructor with over 14 years of experience across FX, commodities, US equity indices, and global macro markets.


