Gold Price Forecast: XAU/USD eyes $1,760 following sharp decline on US jobs data
- XAU/USD came under strong bearish pressure in American session.
- Nonfarm Payrolls in US rose more than expected in July.
- Additional losses are likely with a daily close below 100-day SMA.

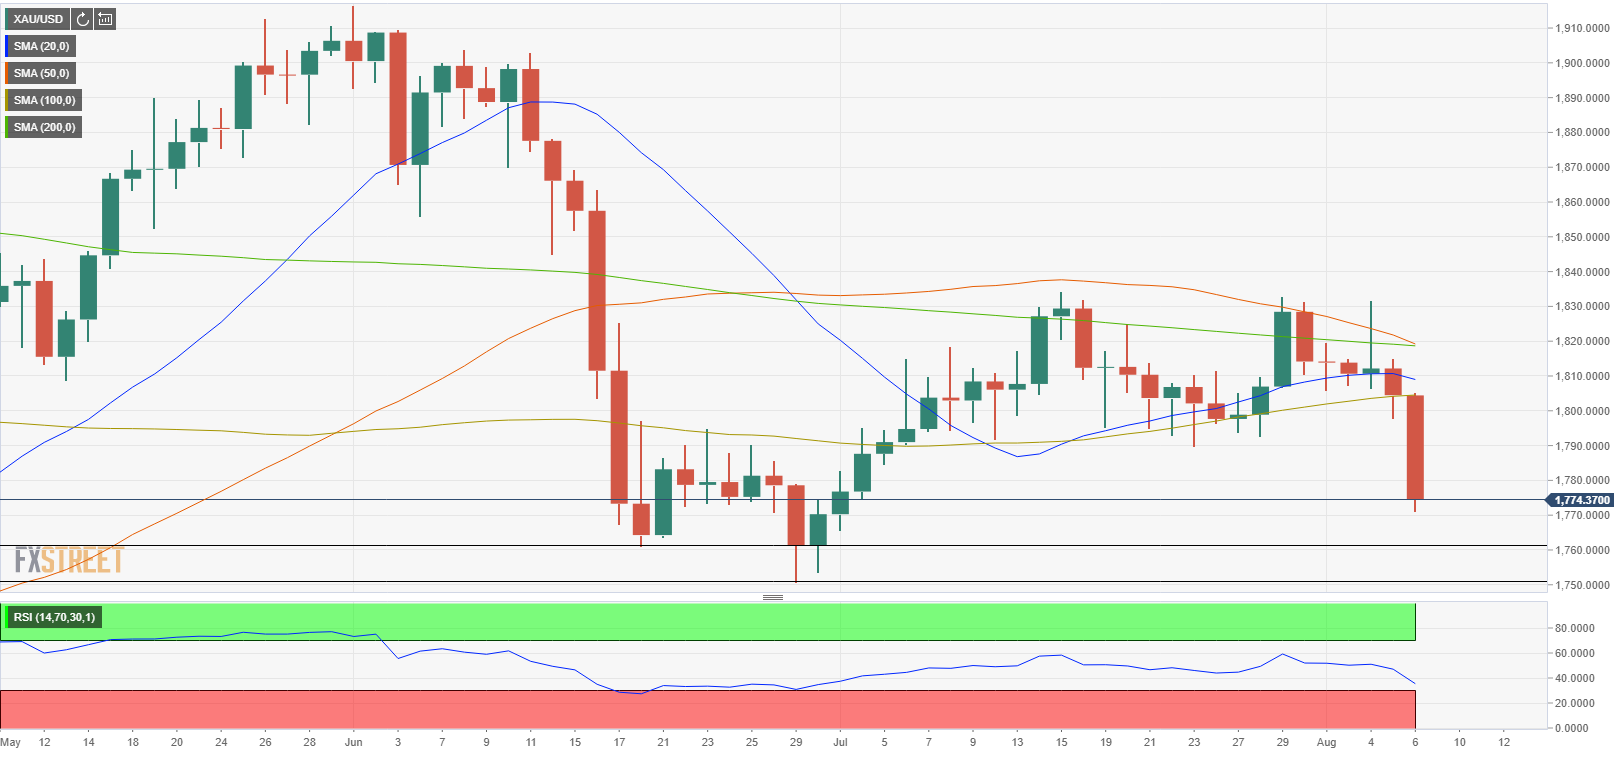
After spending the first half of the day moving sideways near $1,800, the XAU/USD fell sharply in the early American session and was last seen trading at its lowest level since early July at $1,174, losing 1.7% on a daily basis.
Renewed USD strength following the impressive July jobs report from the US seems to be weighing heavily on XAU/USD on Friday.
The US Bureau of Labor Statistics announced that Nonfarm Payrolls (NFP) in the US rose by 943,000 in July, compared to analysts' estimate of 870,000. Moreover, June's increase got revised up to 938,000 from 850,000 and the Unemployment Rate declined to 5.4% from 5.9% in June.
Reflecting the positive impact of the NFP data on the greenback, the US Dollar Index advanced to its highest level in more than a week and was last seen gaining 0.38% on the day at 92.61.
Breaking: US Nonfarm Payrolls rise by 943,000 in July, USD extends rally.
Commenting on the data, "with these figures, has the US economy made "substantial further progress? That is the term the all-powerful Federal Reserve set for withdrawing stimulus. The answer seems to be positive," said FXStreet analyst Yohay Elam. "Prospects of fewer dollars printed mean a stronger greenback, while the specter of rate hikes gives investors a cause for a pause when coming to stocks."
NFP Quick Analysis: Tremendous news for workers and the dollar, bad news for stocks.
Gold technical outlook
With this recent decline, the Relative Strength Index (RSI) indicator on the daily chart dropped below 40 but continues to stay above 30, suggesting that there is more room on the downside before XAU/USD become technically oversold. Furthermore, the pair remains on track to close below the 100-day SMA for the first time since mid-June, reaffirming the bearish shift in the near-term technical outlook.
On the downside, the initial resistance is located at $1,760 (static level). Below that level, the next target could be seen at $1,750 (June 29 low).
Resistances, on the other hand, are located at $1,800 (psychological level), $1,805 (100-day SMA) and $1,820 (200-day SMA).
Additional levels to watch for
Author

Eren Sengezer
FXStreet
As an economist at heart, Eren Sengezer specializes in the assessment of the short-term and long-term impacts of macroeconomic data, central bank policies and political developments on financial assets.


