Gold Price Forecast: XAUUSD could see a dead cat bounce towards $1,837 – Confluence Detector
- The end-of-quarter flows could save the day for Gold Price.
- Policy panel at ECB Forum powered the US dollar, ahead of PCE inflation.
- XAUUSD bulls jump in even as US Treasury yields rebound amid mixed markets.

Fed Chair Jerome Powell’s pledge to control inflation by resorting to aggressive tightening powered the US dollar across the board while widening the policy divergence between the ECB and BOE. This weighed heavily on the non-interest-bearing Gold Price even though the US Treasury yields tumbled amid risk-off flows. With the ECB Sintra Forum out of the way, the end-of-the-quarter flows and the US inflation data will drive the metal’s price action. Any reprieve in gold price is likely to remain temporary amid hawkish Fed stance and growing recession fears, which are likely to keep the safe-haven demand for the dollar buoyed.
Also read: Attention turns to inflation data
Gold Price: Key levels to watch
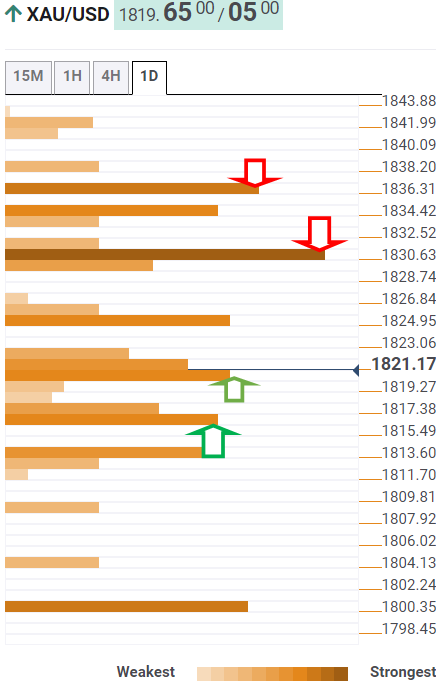
The Technical Confluence Detector shows that Gold Price is witnessing a dead cat bounce after three straight days of losses. On its recovery mode, the bright metal is challenging strong resistance around $1,822, which is the convergence of the SMA5 one-day and SMA1o four-hour.
The confluence of the Fibonacci 61.8% one-day and the Fibonacci 23.6% one-week at $1,825 will threaten XAU bulls. Further up, bulls will need to crack the $1,831 barrier, where the SMA10 one-day, pivot point one-day R1 and SMA50 four-hour.
The next critical resistance around $1,835 will test the bearish commitments. That level is the meeting point of the SMA100 four-hour, Fibonacci 38.2% one-month and Fibonacci 61.8%
On the flip side, the immediate support is seen at the Fibonacci 38.2% one-day at $1,819, below which the 23.6% Fibonacci level one-day at $1,817 will be probed.
If the downside pressure intensifies, then sellers will attack the pivot point one-week S1 at $1,813. The pivot point one-day S1 at $1,808 will be the last line of defense for gold buyers.
Here is how it looks on the tool
About Technical Confluences Detector
The TCD (Technical Confluences Detector) is a tool to locate and point out those price levels where there is a congestion of indicators, moving averages, Fibonacci levels, Pivot Points, etc. If you are a short-term trader, you will find entry points for counter-trend strategies and hunt a few points at a time. If you are a medium-to-long-term trader, this tool will allow you to know in advance the price levels where a medium-to-long-term trend may stop and rest, where to unwind positions, or where to increase your position size.
Author

Dhwani Mehta
FXStreet
Residing in Mumbai (India), Dhwani is a Senior Analyst and Manager of the Asian session at FXStreet. She has over 10 years of experience in analyzing and covering the global financial markets, with specialization in Forex and commodities markets.


