|

Gold Price Forecast: XAUUSD aims to recapture a 10-week high around $1,770 as less-hawkish Fed bets soar

  • Gold price is marginally from the 200-EMA as Fed may slow down the current pace of rate hikes.
  • The 10-year US Treasury yields have witnessed a bloodbath as bets over 75 bps rate hike have plummeted.
  • A sheer decline in consumer spending is responsible for lower-than-projected US CPI data.

Gold price (XAUUSD) has witnessed a juggernaut rally after a sheer decline in US inflation figures on Thursday. The precious metal gained around 3% from Wednesday’s closing price and is now expected to recapture a 10-week high at $1,765.58 ahead.

Meanwhile, the US dollar index (DXY) nose-dived to 107.80 as a bumper decline in the US Consumer Price Index (CPI) has accelerated the odds for a less-hawkish commentary from Federal Reserve (Fed) policymakers for December monetary policy meeting. The 10-year US Treasury yields have witnessed a bloodbath and have dropped to 3.8% as chances for a fifth consecutive 75 basis point (bps) rate hike have plummeted below 15%, as per the CME FedWatch tool.

Thanks to the sheer decline in consumer spending in the third quarter of CY2022 that the headline CPI dropped to 7.7% and core CPI declined to 6.3%. Now, chatters over increasing peak for the terminal rate by the Fed may pause for a while and Fed chair Jerome Powell will also discuss supporting the economic prospects too to safeguard the economy from a recession situation.

The market participants should be aware of the fact that the US markets will remain closed on Friday on account of Veterans Day.

Gold technical analysis

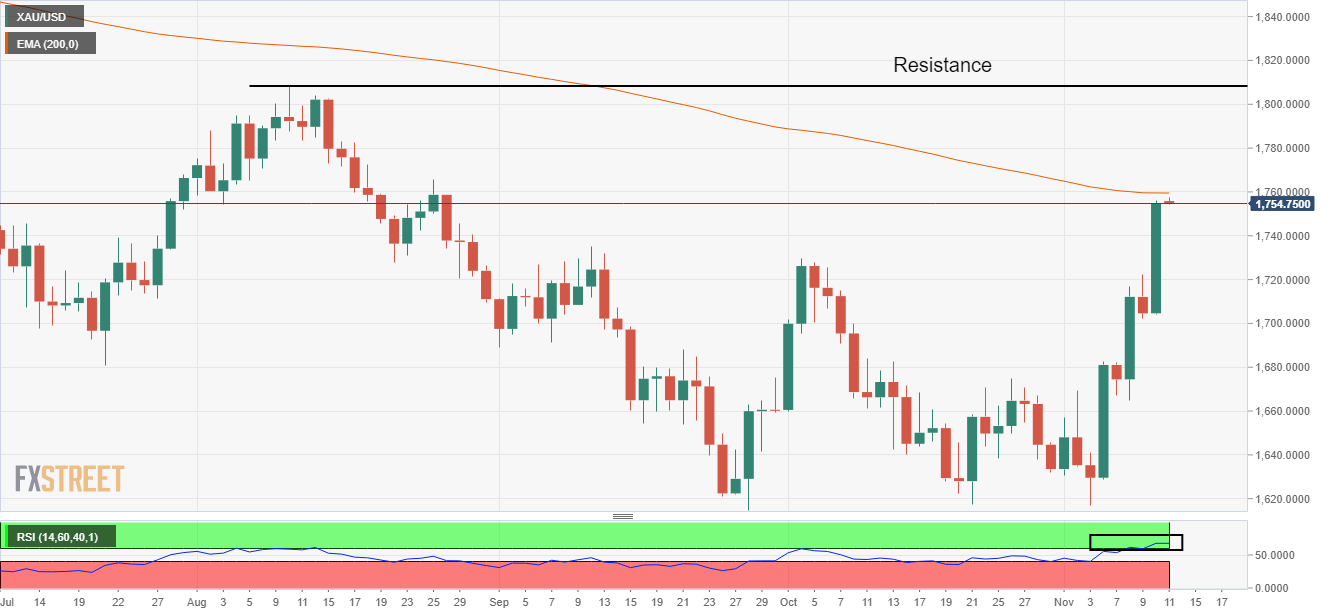
On the daily scale, the gold price is marginally far from kissing the 200-period Exponential Moving Average (EMA) at $1,758.00 for the first time in the past five months. The horizontal resistance placed from August 10 high at $1,807.93 will act as major hurdle ahead.

The Relative Strength Index (RSI) (14) has overstepped 60.00 for the first time in seven months, showing no signs of divergence and overbought.

Gold daily chart

XAU/USD

Overview
Today last price1754.36
Today Daily Change49.78
Today Daily Change %2.92
Today daily open1704.58
 
Trends
Daily SMA201656.1
Daily SMA501673.51
Daily SMA1001716.29
Daily SMA2001803.93
 
Levels
Previous Daily High1722.4
Previous Daily Low1702.23
Previous Weekly High1682.49
Previous Weekly Low1616.69
Previous Monthly High1729.58
Previous Monthly Low1617.35
Daily Fibonacci 38.2%1709.93
Daily Fibonacci 61.8%1714.7
Daily Pivot Point S11697.07
Daily Pivot Point S21689.57
Daily Pivot Point S31676.9
Daily Pivot Point R11717.24
Daily Pivot Point R21729.91
Daily Pivot Point R31737.41

Author

Sagar Dua

Sagar Dua

FXStreet

Sagar Dua is associated with the financial markets from his college days. Along with pursuing post-graduation in Commerce in 2014, he started his markets training with chart analysis.

More from Sagar Dua
Share:

Editor's Picks

EUR/USD seems fragile below 1.1700 as Middle East war boosts energy prices

The EUR/USD pair trades flat at around 1.1680 during the Asian trading session on Tuesday, but broadly seems vulnerable, being close to its five-week low. The major currency pair is under pressure as surging oil prices due to the United States-Israel war with Iran have increased the risks of higher inflation for the Old Continent.

GBP/USD hovers around 1.3400 with bearish pressure intact

GBP/USD edges higher after three days of losses, trading around 1.3400 during the Asian hours on Tuesday. The technical analysis of the daily chart indicates an ongoing bearish bias, as the pair trades within a descending channel pattern.

Gold sticks to gains above $5,350 amid sustained safe-haven demand; firmer USD caps gains

Gold sticks to its positive bias for the third straight day and trades above the $5,350 level heading into the European session on Tuesday. Concerns about a broader regional conflict in the Middle East continue to weigh on investors' sentiment and underpin demand for the traditional safe-haven bullion.

Stellar risks deeper losses as derivatives metrics turn negative

Stellar is trading red below $0.16 at the time of writing on Tuesday, after a slight recovery the previous day. Weakening derivatives data caps the recovery, while an unfavorable technical outlook projects a deeper correction for the XLM token in the upcoming days.

The market is not panicking it is repricing the probability distribution of Oil and time

At the end of the day, markets do not trade morality or geopolitics. They trade transmission channels. And the only channel that truly matters in this maelstrom runs through the price of energy and the time value of money.

Grass 20% bullish breakout defies broader market weakness

Grass (GRASS) is edging up above $0.30 at the time of writing on Monday. The token’s notable 20% intraday surge stands out amid heightened volatility in the broader crypto market.