Gold Price: XAU/USD’s falling wedge comforts buyers above $1,800, US data eyed
- Gold price extends rebound from three-month low towards refreshing daily high.
- Improvement in risk appetite adds strength to recovery moves inside bullish chart pattern.
- Fed’s Powell, headlines from China underpin latest cautious optimism ahead of US Michigan Consumer Sentiment Index for May.
- Gold Price Forecast: XAU/USD’s dead cat bounce could seek validation at $1,836

Gold price (XAU/USD) recover during the sluggish Asian session on Friday, following a slump to the lowest levels since February the previous day. That said, the bullion quotes $1,827 as the latest price as traders await preliminary readings of the US Michigan Consumer Sentiment data for May.
The yellow metal’s latest rebound could be linked to the US PPI’s matching of the 0.5% MoM market consensus for April, as well as Fed Chairman Jerome Powell’s reiteration of 50 bps rate hikes in the next two meetings. On the same line were comments from San Francisco Fed President Mary Daly who mentioned, “Is it 50, is it 25, is it 75? Those are things that I’ll deliberate with my colleagues, but my own starting point is we don’t want to go so quickly or so abruptly that we surprise Americans”.
Also, China’s push for more employment generation to the college students and hopes of reaching covid-zero conditions in Shanghai after mid-May previously favored USD/CAD bears. On the same line was a three-day “at home” stay for residents for covid testing to tame and confirm the covid resurgence in Beijing.
While cheering the cautious optimism, the US US 10-year Treasury yields portray a corrective pullback after refreshing a two-week low the previous day, around 2.89% by the press time, whereas the S&P 500 Futures print rises 1.0% while licking its wound near one-year low.
Moving on, the US Michigan Consumer Sentiment Index, expected 64 versus 65.2 prior, will undoubtedly be important due to its preliminary nature and also because it comprises hints for inflation expectations. Also crucial for gold traders to follow are headlines concerning coronavirus, geopolitics and Fedspeak.
Technical analysis
Considering the metal’s moves since April 18, gold portrays a falling wedge bullish chart pattern on the four-hour play. That said, nearly oversold RSI (14) keeps gold buyers hopeful of further recovery moves.
However, a clear break of $1,857, comprising the resistance line of the wedge, won’t be enough for the gold buyers as the 50-SMA level, near $1,863, will act as an extra filter to the north before confirming the upside move.
That said, the monthly peak of $1,909 and late April’s swing high near $2,000 can act as crucial resistances during the metal’s run-up towards the theoretical target surrounding $2,050.
Alternatively, a downside break of the recent low, close to $1,810, will need validation from the $1,800 threshold before directing gold sellers towards the yearly bottom surrounding $1,780.
Gold price: Four-hour chart
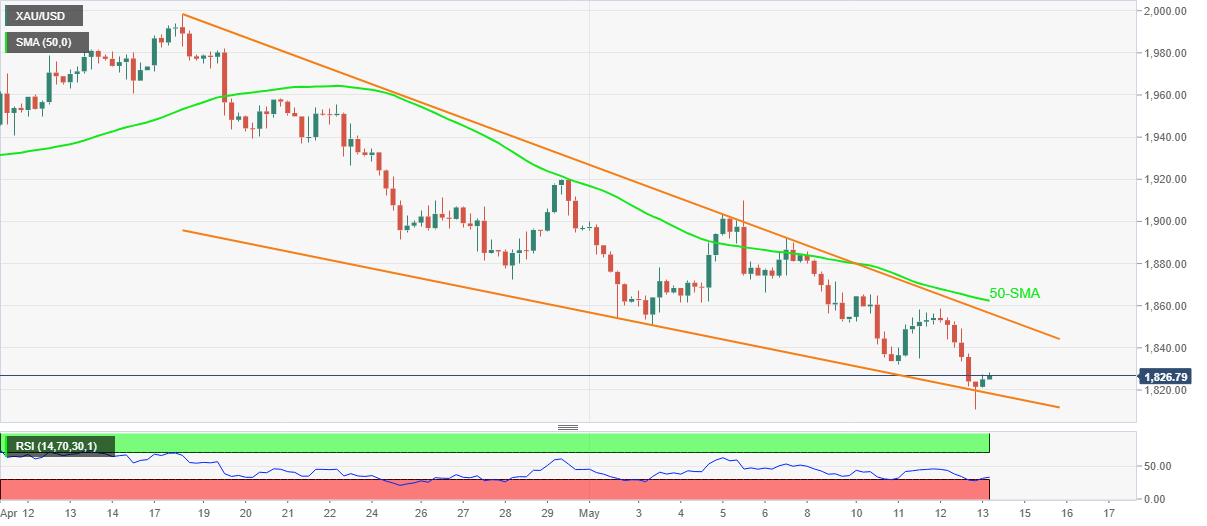
Trend: Further recovery expected
Author

Anil Panchal
FXStreet
Anil Panchal has nearly 15 years of experience in tracking financial markets. With a keen interest in macroeconomics, Anil aptly tracks global news/updates and stays well-informed about the global financial moves and their implications.


