Gold Price Forecast: XAU/USD tumbles on US strong data, hawkish Fed tilt ahead of US NFP
- Gold suffers a 0.20% loss as robust US job figures and mounting rate hike prospects drive US Treasury yields higher.
- Hawkish comments from Dallas Fed President Lorie Logan and a strong ADP report underpin expectations of a July rate hike.
- Traders anticipate further clues from the upcoming US Nonfarm Payrolls report, which could impact Gold’s trajectory.

Gold price slides for two consecutive days after a busy economic calendar in the United States (US) emphasized the resilience of the economy, which justifies the Federal Reserve (Fed) 25 bps rate hike at the upcoming July meeting. On Thursday, the XAU/USD, after reaching a daily high of $1927.55, prints losses of 0.20% and exchanges hands at $1910.70.
Gold continues downward slide: US economic resilience and imminent Fed tightening dampen bullish appeal
The yellow metal is under pressure as the latest US ADP National Employment report surprised market participants, as private hiring witnessed the creation of 497,000 jobs in the US economy, surpassing the 228,000 foreseen by analysts. The report came before the US Department of Labor announced that unemployment claims (Initial Jobless Claims) for the week ending July 1 climbed to 248K, exceeding 245K estimates, but the ADP report overshadowed the data.
After the data, XAU/USD’s dropped from around $1928 to $1902, as US Treasury bond yields skyrocketed. The US 10-year Treasury note rises 4.045%, gaining 10 basis points. The US real yields soared to a new yearly high of 1.821%, though, as of writing, it sits at 1.781%, a headwind for the non-yielding metal.
Gold traders will get more clues about the yellow metal’s direction on Friday, as the US Bureau of Labor Statistics (BLS) will reveal the US Nonfarm Payrolls report. Analysts estimate the US economy addd 225K jobs to the economy, and the Unemployment rate is estimated to dip to 3.6%,
The Federal Reserve (Fed) meeting minutes showed that most officials wanted to raise rates but agreed to wait as they assessed the impact of cumulative tightening. Additionally, “almost all” FOMC members agreed that further tightening will be needed this year, suggesting July’s rate hike is almost inevitable.
Regarding that theme, the Dallas Fed President Lorie Logan at a Columbia University event in New York, stated she favored June’s hike, adding “two-thirds of FOMC participants projected at least two more rate increases this year.”
XAU/USD Price Analysis: Technical outlook
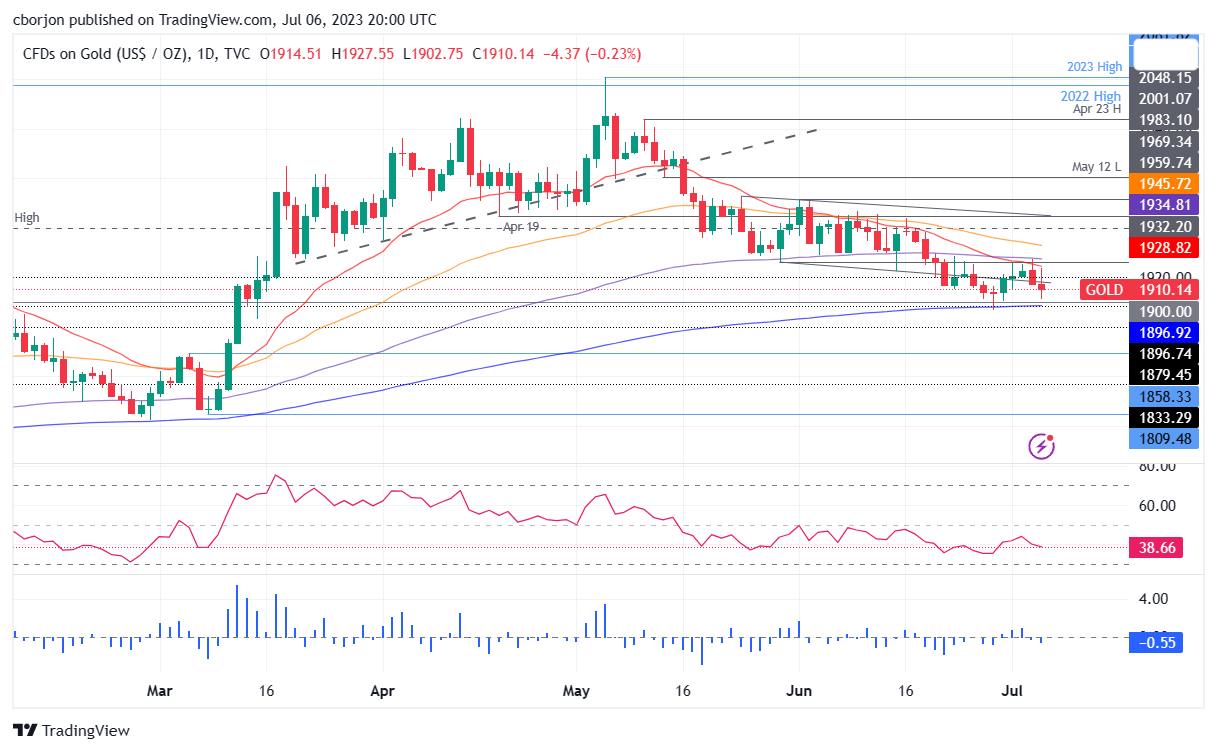
The XAU/USD daily chart depicts Gold as neutral to downward biased, with the 20, 50, and 100-day Exponential Moving Average (EMAs) remaining above the current spot price. For a bearish resumption, XAU/USD must drop below the 200-day EMA at $1896.93, and once done, the XAU/USD next support would be the March 6 daily high at $1879.45, followed by the March 8 swing low at $1809.48.
If XAU/USD remains above $1900, the first resistance would be the 20-day EMA at $1928.88. Once cleared, the next supply zone would be the 50-day EMA at $1945.75.
Author

Christian Borjon Valencia
FXStreet
Markets analyst, news editor, and trading instructor with over 14 years of experience across FX, commodities, US equity indices, and global macro markets.


