- Gold dives to five-week lows at around $1850 as bears eye the 100-DMA beneath $1820.
- Market participants are eyeing Tuesday’s US CPI data, which could reaffirm the disinflation process has already started.
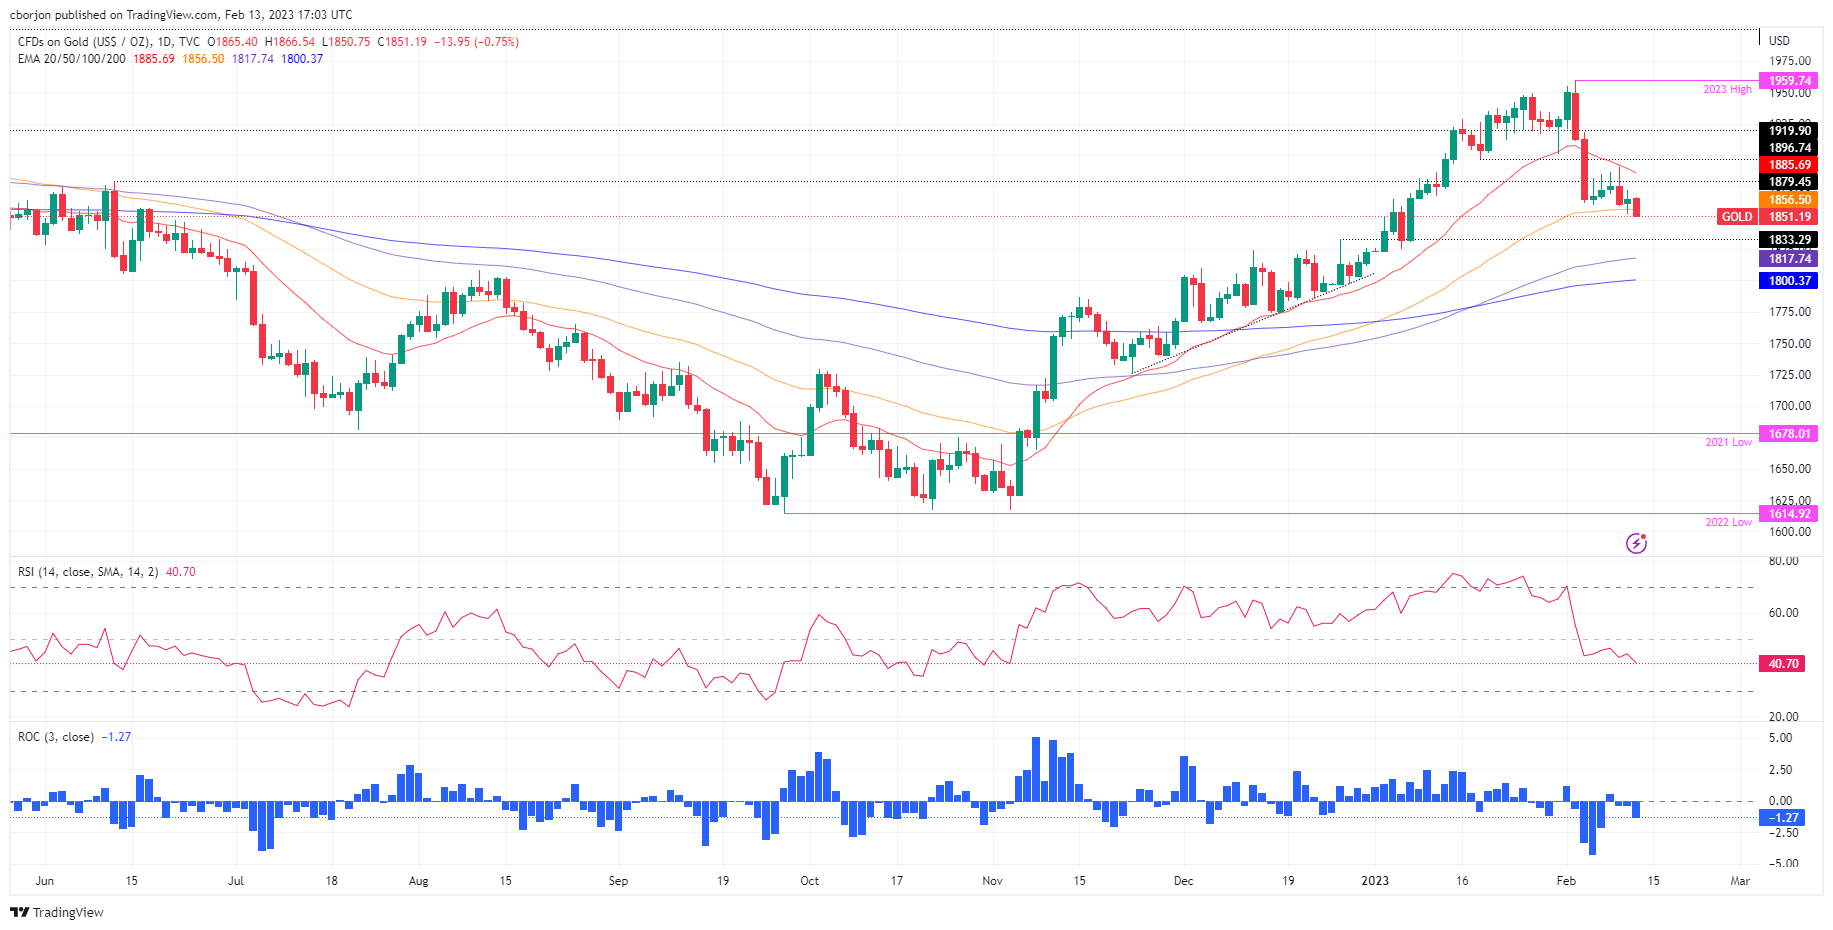
- XAU/USD Price Analysis: A daily close below $1850 would pave the way toward $1820.
Gold price retreated from last Friday’s highs of $1872.22 and dropped toward the $1850 area on Monday despite the US Dollar (USD) fall, ahead of a vital inflation report from the United States (US). Additionally, US Treasury yields, albeit edging down, remain at around five-week highs. At the time of writing, the XAU/USD is trading at $1852.88.
Gold retraces to $1850 weighed by a risk-on mood
XAU/USD remains pressured, while the US Dollar Index, a measure of the buck’s value vs. a basket of peers, drops 0.18%, down at 103.391, undermined by the US 10-year Treasury bond yield, with the 10-year benchmark not dropping one and a half bps to 3.726%.
Investors are awaiting a report from the Bureau of Labor Statistics (BLS) on Tuesday, revealing the Consumer Price Index (CPI) for January, estimated at 6.2% YoY, lower than the 6.5% in December. The core CPI excludes volatile items like food and energy, which is foreseen at 5.5% YoY, from 5.7% in the previous month.
In the meantime, Fed hawkish commentary continued with the Fed Governor Michell Bownman, who said that the Federal Reserve (Fed) needs to continue to raise rates to get the Federal Funds Rate(FFR) to a sufficiently restrictive level, as the US central bank battles high inflationary pressures.
Of late, the US Federal Reserve of New York revealed inflation expectations for the year hold steady at 5%. For a three-year horizon, the poll showed that inflation would stand at 2.7%, down from December 2.9%, while for a five-year span, it was projected at 2.5%, vs. 2.4 in the prior month.
XAU/USD Technical analysis
Technically speaking, XAU/USD remains neutral to slightly downward biased. At the time of typing, the yellow metal falls beneath the 50-day Exponential Moving Average (EMA) At $1856.58, exacerbating further selling pressure. On the downside, the following support levels would be the December 26 daily high of 1833.29 turned support, followed by the 100-day EMA at 1817.77, and the confluence of the 200-day EMA, and the figure at $1800.
Information on these pages contains forward-looking statements that involve risks and uncertainties. Markets and instruments profiled on this page are for informational purposes only and should not in any way come across as a recommendation to buy or sell in these assets. You should do your own thorough research before making any investment decisions. FXStreet does not in any way guarantee that this information is free from mistakes, errors, or material misstatements. It also does not guarantee that this information is of a timely nature. Investing in Open Markets involves a great deal of risk, including the loss of all or a portion of your investment, as well as emotional distress. All risks, losses and costs associated with investing, including total loss of principal, are your responsibility. The views and opinions expressed in this article are those of the authors and do not necessarily reflect the official policy or position of FXStreet nor its advertisers. The author will not be held responsible for information that is found at the end of links posted on this page.
If not otherwise explicitly mentioned in the body of the article, at the time of writing, the author has no position in any stock mentioned in this article and no business relationship with any company mentioned. The author has not received compensation for writing this article, other than from FXStreet.
FXStreet and the author do not provide personalized recommendations. The author makes no representations as to the accuracy, completeness, or suitability of this information. FXStreet and the author will not be liable for any errors, omissions or any losses, injuries or damages arising from this information and its display or use. Errors and omissions excepted.
The author and FXStreet are not registered investment advisors and nothing in this article is intended to be investment advice.


Recommended content
Editors’ Picks

AUD/USD: A challenge of the 2025 peaks looms closer
AUD/USD rose further, coming closer to the key resistance zone around 0.6400 despite the strong rebound in the Greenback and the mixed performance in the risk-associated universe. The pair’s solid price action was also propped up by a firm jobs report in Oz.

EUR/USD: Extra gains likely above 1.1400
EUR/USD came under renewed downside pressure following another bull run to the 1.1400 region on Thursday. The knee-jerk in spot came in response to the decent bounce in the US Dollar, while the dovish tone from the ECB’s Lagarde seems to have also contributed to the bearish developments in the pair.

Gold bounces off daily lows, back near $3,320
The prevailing risk-on mood among traders challenges the metal’s recent gains and prompts a modest knee-jerk in its prices on Thursday. After bottoming out near the $3,280 zone per troy ounce, Gold prices are now reclaiming the $3,320 area in spite of the stronger Greenback.

Binance CEO affirms company's involvement in advising countries on Bitcoin Reserve
Binance CEO Richard Teng shared in a report on Thursday that the cryptocurrency exchange has advised different governments on crypto regulations and the need to create a strategic Bitcoin reserve.

Future-proofing portfolios: A playbook for tariff and recession risks
It does seem like we will be talking tariffs for a while. And if tariffs stay — in some shape or form — even after negotiations, we’ll likely be talking about recession too. Higher input costs, persistent inflation, and tighter monetary policy are already weighing on global growth.

The Best brokers to trade EUR/USD
SPONSORED Discover the top brokers for trading EUR/USD in 2025. Our list features brokers with competitive spreads, fast execution, and powerful platforms. Whether you're a beginner or an expert, find the right partner to navigate the dynamic Forex market.