- Gold price eases before resuming the next leg higher towards $1,884
- Gold remains undeterred by the global tightening calls after hot US inflation.
- Gold capitalizes on inflation fears, buyers look to retain control.
Gold price is snapping its week-long winning streak, as bulls take a breather ahead of Tuesday’s critical US Retail Sales release. Underlying surging inflationary risks and a dip in the US consumer confidence have added to the Fed’s dilemma on the timing of a potential rate hike, which renders positive for gold buyers. Meanwhile, upbeat Chinese economic data have lifted the overall market mood at the start of a fresh week, warranting caution for the gold price rally.
Read: Gold Price Forecast: XAU/USD down but not out, a test of $1,900 remains on the cards
Gold Price: Key levels to watch
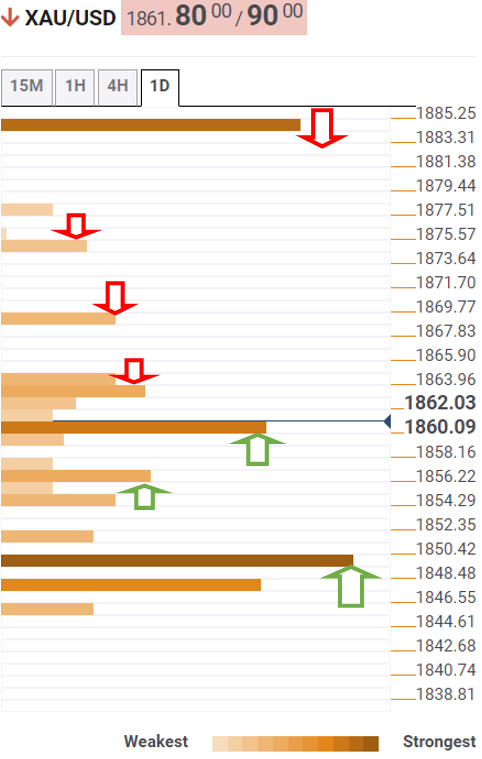
The Technical Confluences Detector shows that gold price has recaptured a powerful support-turned-resistance at $1,860, which is the convergence of the Fibonacci 38.2% one-day and SMA10 four-hour.
The Fibonacci 23.6% one-day at $1,864 will likely challenge the rebound, with the next upside target envisioned at $1,869, the previous day’s high.
Further up, the pivot point one-day R1 at $1,874 will be on the buyers’ radars. Acceptance above the latter will trigger a fresh advance towards $1,884, the confluence of the pivot point one-month R3 and pivot point one-day R2.
Alternatively, if the sellers find control below daily lows of $1,756, then the Fibonacci 61.8% one-day at $1,853 will be put at risk.
The level to beat for gold bears is at around $1,850, which is the intersection of the pivot point one-month R2, Fibonacci 38.2% one-week and SMA5 one-day.
Here is how it looks on the tool
About Technical Confluences Detector
The TCD (Technical Confluences Detector) is a tool to locate and point out those price levels where there is a congestion of indicators, moving averages, Fibonacci levels, Pivot Points, etc. If you are a short-term trader, you will find entry points for counter-trend strategies and hunt a few points at a time. If you are a medium-to-long-term trader, this tool will allow you to know in advance the price levels where a medium-to-long-term trend may stop and rest, where to unwind positions, or where to increase your position size.
Information on these pages contains forward-looking statements that involve risks and uncertainties. Markets and instruments profiled on this page are for informational purposes only and should not in any way come across as a recommendation to buy or sell in these assets. You should do your own thorough research before making any investment decisions. FXStreet does not in any way guarantee that this information is free from mistakes, errors, or material misstatements. It also does not guarantee that this information is of a timely nature. Investing in Open Markets involves a great deal of risk, including the loss of all or a portion of your investment, as well as emotional distress. All risks, losses and costs associated with investing, including total loss of principal, are your responsibility. The views and opinions expressed in this article are those of the authors and do not necessarily reflect the official policy or position of FXStreet nor its advertisers. The author will not be held responsible for information that is found at the end of links posted on this page.
If not otherwise explicitly mentioned in the body of the article, at the time of writing, the author has no position in any stock mentioned in this article and no business relationship with any company mentioned. The author has not received compensation for writing this article, other than from FXStreet.
FXStreet and the author do not provide personalized recommendations. The author makes no representations as to the accuracy, completeness, or suitability of this information. FXStreet and the author will not be liable for any errors, omissions or any losses, injuries or damages arising from this information and its display or use. Errors and omissions excepted.
The author and FXStreet are not registered investment advisors and nothing in this article is intended to be investment advice.
Recommended content
Editors’ Picks

EUR/USD clings to strong daily gains near 1.0900
EUR/USD trades at its strongest level since mid-October near 1.0900 after starting the week with a bullish gap. The uncertainty surrounding the US election outcome weighs on the US Dollar and helps the pair continue to push higher.

GBP/USD holds above 1.2950 as USD stays under pressure
GBP/USD stays in positive territory above 1.2950 after failing to clear 1.3000 earlier in the day. Heading into the US presidential election, the 10-year US Treasury bond yield is down more than 2% on the day, weighing on the USD and allowing the pair to hold its ground.

Gold trades around $2,730
Gold price is on the defensive below $2,750 in European trading on Monday, erasing the early gains. The downside, however, appears elusive amid the US presidential election risks and the ongoing Middle East geopolitical tensions.

Three fundamentals for the week: Toss up US election, BoE and Fed promise a roller coaster week Premium
Harris or Trump? The world is anxious to know the result of the November 5 vote – and may have to wait long hours for the outcome. Markets will also respond to the composition of Congress. The Bank of England and the Federal Reserve will enter the fray afterward.

US presidential election outcome: What could it mean for the US Dollar? Premium
The US Dollar has regained lost momentum against its six major rivals at the beginning of the final quarter of 2024, as tensions mount ahead of the highly anticipated United States Presidential election due on November 5.

Best Forex Brokers with Low Spreads
VERIFIED Low spreads are crucial for reducing trading costs. Explore top Forex brokers offering competitive spreads and high leverage. Compare options for EUR/USD, GBP/USD, USD/JPY, and Gold.
