Gold Price Forecast: XAU/USD hangs near daily low, just above $1,855 level
- Gold snaps seven-day uptrend while easing from five-month high, pressured around intraday low of late.
- Market sentiment dwindles amid mixed concerns over US inflation, stimulus.
- China data, PBOC moves favor risk-on mood, US Retail Sales, Sino-American talks eyed.
- Gold Weekly Forecast: XAU/USD capitalizes on inflation fears, buyers look to retain control

Update: Gold witnessed a modest pullback from a fresh five-month high touched earlier this Monday and remained on the defensive through the early European session. The XAU/USD, for now, seems to have snapped seven consecutive days of the losing streak and was last seen hovering near the lower end of its daily trading range, just above the $1,855 level. The downtick could be solely attributed to some profit-taking amid firming expectations for an early policy tightening by the Fed, which tends to weigh on the non-yielding yellow metal.
That said, a combination of factors should continue to lend some support to gold prices and warrants caution for bearish traders. The US dollar added to Friday's losses triggered by data showing that consumer sentiment plunged to a 10-year low in November. This, along with sliding US Treasury bond yields, undermined the greenback, which, in turn, should act as a tailwind for the dollar-denominated commodity. Apart from this, the prevalent cautious market mood could further limit the downside for the safe-haven precious metal.
Hence, it will be prudent to wait for a strong follow-through selling before confirming that the recent positive move witnessed over the past two weeks or so has run out of steam. Market participants now look forward to the US economic docket, featuring the only release of the Empire State Manufacturing Index later during the early North American session. Traders will further take cues from the US bond yields, the US bond yields and the broader market risk sentiment to grab some short-term opportunities around gold.
Previous update: Gold (XAU/USD) licks wounds near $1,860 during the first negative day in eight amid early Monday. In doing so, the yellow metal eases from the highest levels since June while stepping back from the yearly resistance line. That said, the pullback moves fail to cheer softer US Treasury yields, as well as the US dollar, amid mixed sentiment.
The US Dollar Index (DXY) drops 0.11% intraday while extending Friday’s pullback from the highest levels since July 2020. Helping the greenback bears are the US 10-year Treasury yields that consolidate the previous week’s rebound, down three basis points (bps) to 1.55% at the latest. On the same line is the mildly positive market sentiment that reduces gold’s safe-haven demand.
Behind the market’s moves are the mixed concerns over the US stimulus and inflation, as well as the Fed rate hike following Friday’s surprisingly downbeat Michigan Consumer Sentiment data that slumped to a 10-year low. Additionally, the recent comments from US Treasury Secretary Janet Yellen and Federal Reserve Bank of Minneapolis President Neel Kashkari, coupled with the hopes of the US-China phase 1 deal, also favor the mood.
While US Treasury Secretary Yellen defied chatters that the incoming stimulus will fuel more inflation, Fed’s Kashkari reiterate that the inflation run-up is ‘transitory’. Further, the Financial Times (FT) cited familiar sources to say, “US President Joe Biden and China’s President Xi Jinping will discuss ways to prevent tensions from spiraling into conflict, in the face of rising concern about Taiwan and Beijing’s nuclear arsenal.”
Looking forward, US Retail Sales for October, expected to keep 0.7% MoM growth on Tuesday, will be the key catalysts to watch for near-term direction. Also important will be the US-China talks and the US aid package progress. Should the reflation fears recede, as they are now, gold may witness the much-awaited pullback.
Technical analysis
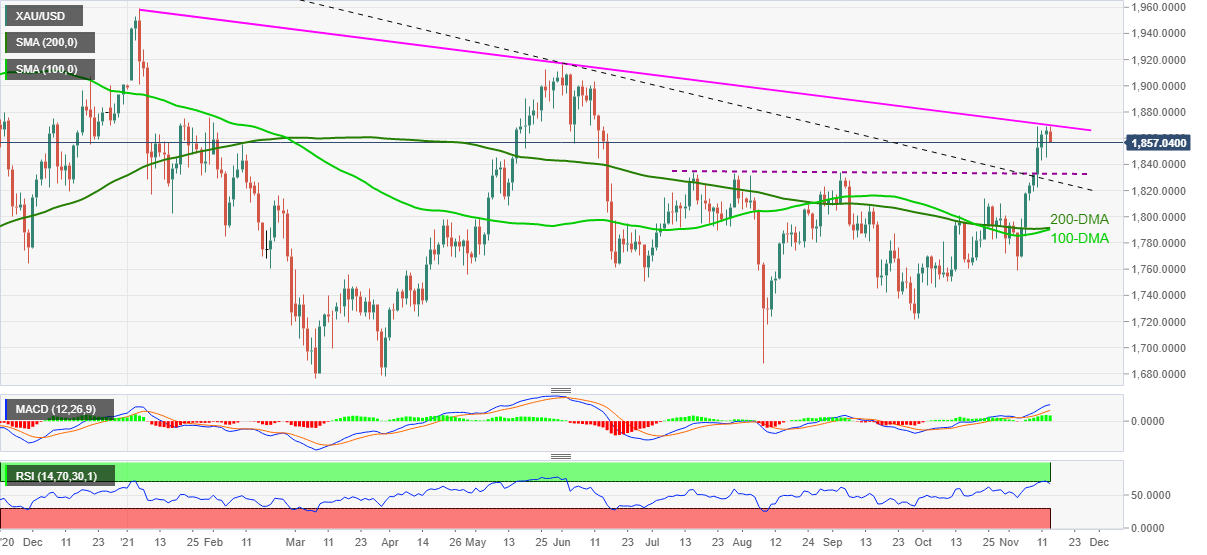
Gold managed to cross an important descending trend line resistance from August 2020 and a four-month-old horizontal hurdle during the biggest weekly run-up since May. However, overbought RSI conditions probe the bulls around a downward sloping trend line from January near $1,870.
Adding to the upside filters are the tops marked during late January 2021 around $1,875-76, a break of which could propel the quote towards breaking the $1,900 threshold, as well as target June’s high close to $1,917.
Meanwhile, pullback moves may aim for a $1,834 re-test but remain less challenging until marking a daily close below the broad resistance line, now support around $1,827.
If at all the gold bears manage to conquer the $1,827 resistance-turned-support, a confluence of the 100-DMA and 200-DMA, surrounding $1,790, will be in focus.
Gold: Daily chart
Trend: Further weakness expected
Author

Anil Panchal
FXStreet
Anil Panchal has nearly 15 years of experience in tracking financial markets. With a keen interest in macroeconomics, Anil aptly tracks global news/updates and stays well-informed about the global financial moves and their implications.


