- Gold prices will likely sustain below $1,750.00 as investors await US Jackson Hole Symposium.
- Mixed commentary from Fed policymakers on policy guidance has confused investors.
- Apart from the US Jackson Hole Symposium, the US Durable Goods data also hold significant importance.
Gold price (XAU/USD) has declined consecutively for five trading sessions after printing a monthly high of $1,807.96. The precious metal has slipped below $1,750.00 for the first time in August. It is likely to establish below the above-mentioned critical point as investors are trimming their longs from gold assets dramatically on an expectation of hawkish guidance by the Federal Reserve (Fed).
Earlier, observing mixed comments from the Fed minutes on policy guidance brought exhaustion to the gold rally. St. Louis Fed President James Bullard favored one more 75 basis points (bps) interest rate hike to get price stability sooner. While a few Fed policymakers have passed a commentary on slowing down the pace of hiking interest rates to safeguard their economy from future inflation rate risks to safeguard their economy from inflation risks ahead.
Geopolitical tensions are also weighing heavily on gold prices as that Chinese President Xi Jinping and Russian President Vladimir Putin have confirmed that they will attend the G20 summit in November. This may refresh the mankind assault by Moscow in Ukraine.
On the economic data front, investors are awaiting the release of the US Durable Goods Orders data, which is expected to decline to 0.6% from the prior release of 2%. When the US economy has already displayed an unchanged US core Consumer Price Index (CPI), a decline in the economic data is not lucrative for the US dollar index (DXY).
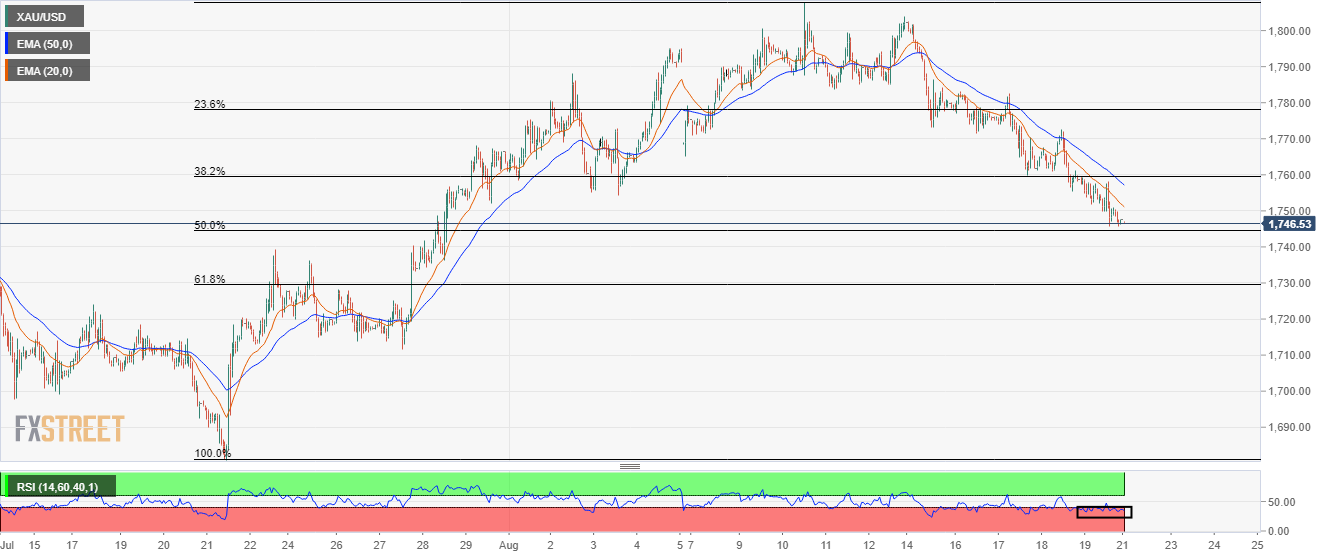
Gold technical analysis
On an hourly scale, gold prices have declined to near 50% Fibonacci retracement (placed from July 21 low at $1,680.91 to August 10 high at $1,807.93) at $1,744.70. The 20-and 50-period Exponential Moving Averages (EMAs) at $1,751.90 and $1,757.50 respectively are declining sharply, which adds to the downside filters. Meanwhile, the Relative Strength Index (RSI) (14) oscillates in a bearish range of 20.00-40.00, which favors more downside ahead.
Gold hourly chart
Information on these pages contains forward-looking statements that involve risks and uncertainties. Markets and instruments profiled on this page are for informational purposes only and should not in any way come across as a recommendation to buy or sell in these assets. You should do your own thorough research before making any investment decisions. FXStreet does not in any way guarantee that this information is free from mistakes, errors, or material misstatements. It also does not guarantee that this information is of a timely nature. Investing in Open Markets involves a great deal of risk, including the loss of all or a portion of your investment, as well as emotional distress. All risks, losses and costs associated with investing, including total loss of principal, are your responsibility. The views and opinions expressed in this article are those of the authors and do not necessarily reflect the official policy or position of FXStreet nor its advertisers. The author will not be held responsible for information that is found at the end of links posted on this page.
If not otherwise explicitly mentioned in the body of the article, at the time of writing, the author has no position in any stock mentioned in this article and no business relationship with any company mentioned. The author has not received compensation for writing this article, other than from FXStreet.
FXStreet and the author do not provide personalized recommendations. The author makes no representations as to the accuracy, completeness, or suitability of this information. FXStreet and the author will not be liable for any errors, omissions or any losses, injuries or damages arising from this information and its display or use. Errors and omissions excepted.
The author and FXStreet are not registered investment advisors and nothing in this article is intended to be investment advice.
Recommended content
Editors’ Picks

Gold gives away some gains, slips back to $2,980
Gold retraced from its earlier all-time highs above the key $3,000 mark on Friday, finding a footing around $2,980 per troy ounce. Profit-taking, rising US yields, and a shift to a risk-on environment seem to be putting the brakes on further gains for the metal.

EUR/USD remains firm and near the 1.0900 barrier
EUR/USD is finding its footing and trading comfortably in positive territory as the week wraps up, shaking off two consecutive daily pullbacks and setting its sights back on the pivotal 1.0900 mark—and beyond.

GBP/USD remains depressed, treads water in the low-1.2900s
GBP/USD is holding steady in consolidation territory after Friday’s opening bell on Wall Street, hovering in the low-1.2900 range. This resilience comes despite disappointing UK data and persistent selling pressure on the USD.

Crypto Today: BNB, OKB, BGB tokens rally as BTC, Shiba Inu and Chainlink lead market rebound
Cryptocurrencies sector rose by 0.13% in early European trading on Friday, adding $352 million in aggregate valuation. With BNB, OKB and BGB attracting demand amid intense market volatility, the exchange-based native tokens sector added $1.9 billion.

Week ahead – Central banks in focus amid trade war turmoil
Fed decides on policy amid recession fears. Yen traders lock gaze on BoJ for hike signals. SNB seen cutting interest rates by another 25bps. BoE to stand pat after February’s dovish cut.

The Best brokers to trade EUR/USD
SPONSORED Discover the top brokers for trading EUR/USD in 2025. Our list features brokers with competitive spreads, fast execution, and powerful platforms. Whether you're a beginner or an expert, find the right partner to navigate the dynamic Forex market.