- Gold price is retesting the breakdown of the Rising Channel pattern amid a delay in US debt-ceiling issues.
- A slower pace in the expansion of US Retail Sales has strengthened expectations of a steady monetary policy stance by the Fed.
- The postponement of approval for the debt-ceiling cap has improved demand for US government bonds.
Gold price (XAU/USD) has shown some buying interest after dropping below $1,990.00 in the Tokyo session. The precious metal has witnessed some recovery as the US Dollar Index (DXY) is struggling in extending its upside move further above 102.70. The Gold price has yet not developed a strong upside bias as it needs to pass through more filters for gaining traction.
S&P500 futures have added decent gains in Asia despite the postponement of approval for raising the US Treasury borrowing cap limit. One thing is for sure that the approval of default is off the table. Every delegate has admitted that the US debt-ceiling cannot be raised along with bulking spending initiatives as it could be a disaster.
The postponement of approval for the debt-ceiling cap has improved demand for US government bonds. This has led to a decline in 10-year US Treasury yields to 3.53%.
The USD Index is facing barricades in extending its recovery above 102.70 as a slower pace in the expansion of US Retail Sales has strengthened expectations of a steady monetary policy stance by the Federal Reserve (Fed). The economic data expanded at a slower pace of 0.4% against the estimate of 0.7%. A mild expansion is insufficient to impact expectations for a steady monetary policy by the Fed.
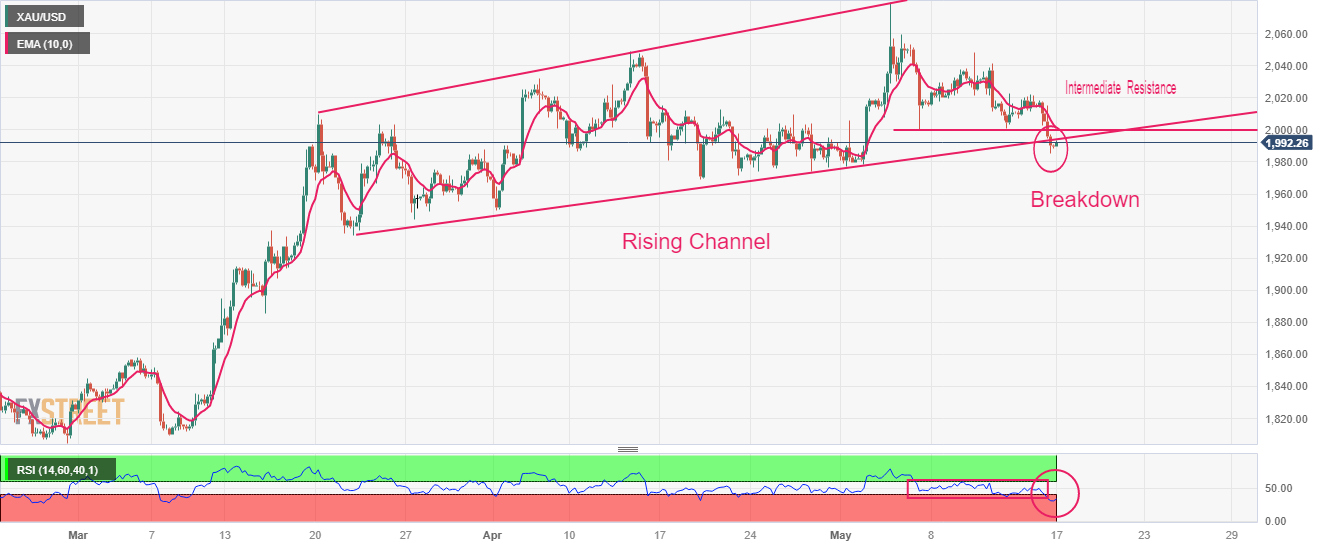
Gold technical analysis
Gold price has delivered a breakdown of the Rising Channel chart pattern formed on a four-hour scale, however, the breakdown needs to pass some more filters yet. An intermediate resistance is plotted from May 05 low at $1,999.54. Downward-sloping 10-period Exponential Moving Average (EMA) at $2,000.00 is barricading the Gold bulls.
The Relative Strength Index (RSI) (14) has slipped into the bearish range of 20.00-40.00, which indicates more downside ahead.
Gold four-hour chart
Information on these pages contains forward-looking statements that involve risks and uncertainties. Markets and instruments profiled on this page are for informational purposes only and should not in any way come across as a recommendation to buy or sell in these assets. You should do your own thorough research before making any investment decisions. FXStreet does not in any way guarantee that this information is free from mistakes, errors, or material misstatements. It also does not guarantee that this information is of a timely nature. Investing in Open Markets involves a great deal of risk, including the loss of all or a portion of your investment, as well as emotional distress. All risks, losses and costs associated with investing, including total loss of principal, are your responsibility. The views and opinions expressed in this article are those of the authors and do not necessarily reflect the official policy or position of FXStreet nor its advertisers. The author will not be held responsible for information that is found at the end of links posted on this page.
If not otherwise explicitly mentioned in the body of the article, at the time of writing, the author has no position in any stock mentioned in this article and no business relationship with any company mentioned. The author has not received compensation for writing this article, other than from FXStreet.
FXStreet and the author do not provide personalized recommendations. The author makes no representations as to the accuracy, completeness, or suitability of this information. FXStreet and the author will not be liable for any errors, omissions or any losses, injuries or damages arising from this information and its display or use. Errors and omissions excepted.
The author and FXStreet are not registered investment advisors and nothing in this article is intended to be investment advice.


Recommended content
Editors’ Picks

AUD/USD strengthens as Trump confirms talks with China
The Australian Dollar extends its rally, with the AUD/USD gaining ground as the US Dollar weakens amid growing concerns over the economic impact of tariffs on the United States. Market participants are closely monitoring developments in US trade negotiations, although trading activity is expected to be subdued due to the Good Friday holiday.

USD/JPY weakens below 142.50 as Japanese CPI came in at 3.6% YoY in March
The USD/JPY pair softens to near 142.25 in a thin trading volume session on Friday. The US Dollar edges lower against the Japanese Yen amid concerns over the economic impact of tariffs.

Gold bounces off daily lows, back near $3,320
The prevailing risk-on mood among traders challenges the metal’s recent gains and prompts a modest knee-jerk in its prices on Thursday. After bottoming out near the $3,280 zone per troy ounce, Gold prices are now reclaiming the $3,320 area in spite of the stronger Greenback.

Ethereum ETFs total net assets plummet over 60%; Justin Sun says he won't sell ETH
Ethereum traded just below $1,600 on Thursday following a 60% plunge in the total net assets of US spot Ether ETFs. Meanwhile, Tron founder Justin Sun said that he won't sell his ETH holdings despite the sustained downtrend in the top altcoin’s price.

Future-proofing portfolios: A playbook for tariff and recession risks
It does seem like we will be talking tariffs for a while. And if tariffs stay — in some shape or form — even after negotiations, we’ll likely be talking about recession too. Higher input costs, persistent inflation, and tighter monetary policy are already weighing on global growth.

The Best brokers to trade EUR/USD
SPONSORED Discover the top brokers for trading EUR/USD in 2025. Our list features brokers with competitive spreads, fast execution, and powerful platforms. Whether you're a beginner or an expert, find the right partner to navigate the dynamic Forex market.